Velocity Trend Planned vs. Actual Dashboard Panel
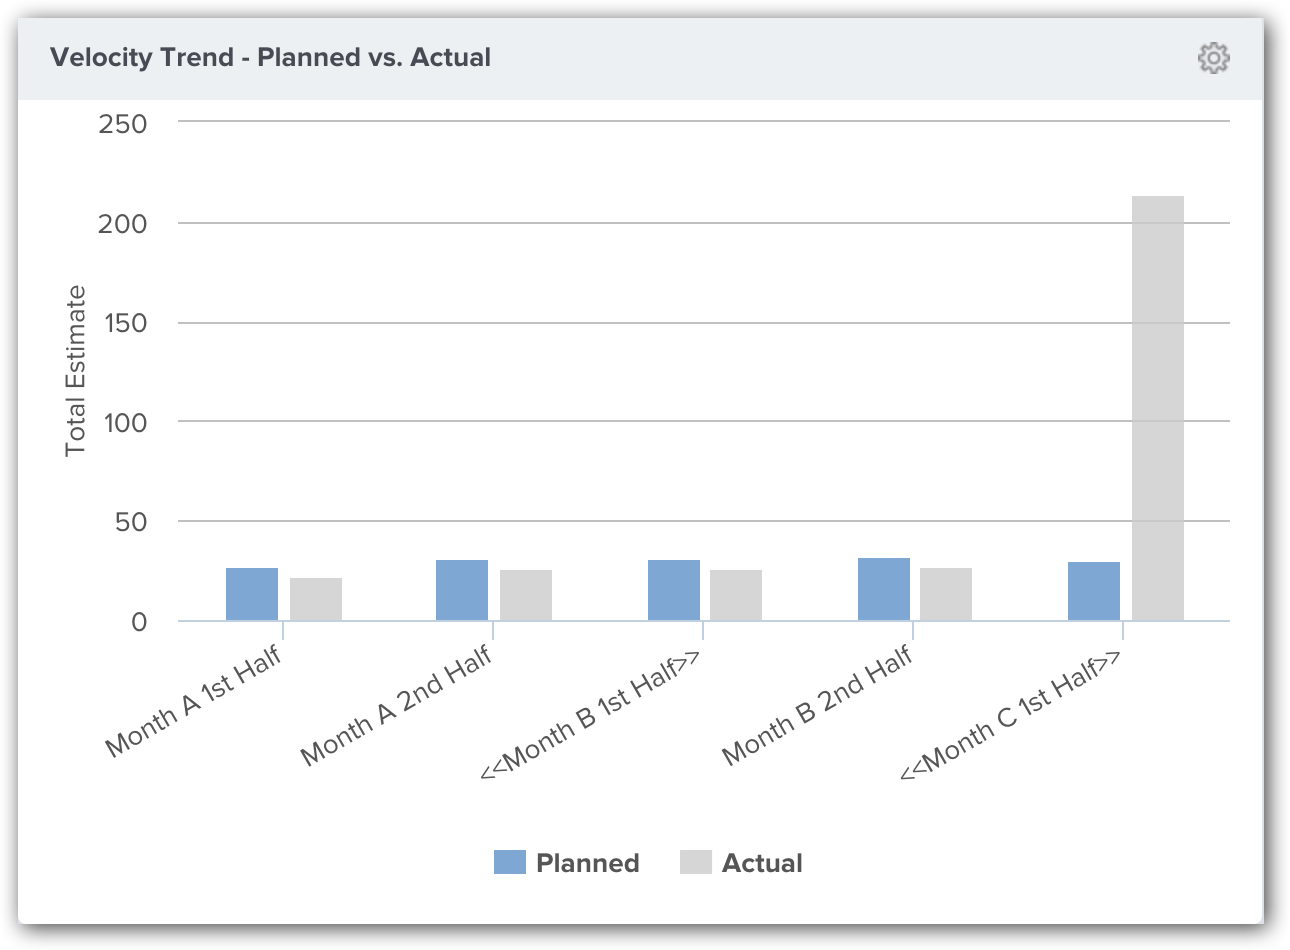
The Analytics Velocity Trend Planned vs Actual dashboard panel allows you to see the total estimate or the total number of Backlog Items that were planned and completed in each sprint or iteration.
Where to Find This Panel
The Velocity Trend Planned vs Actual panel is available on any of the following Analytics dashboards.
- Portfolio > Executive Dashboard
- Program > Product Owner Dashboard
- Team > Dashboard
- Team > Team Dashboard
- Team > Quality Dashboard
- Team > ScrumMaster Dashboard
Measures
- This panel has two bars for each sprint or iteration. One indicating the planned work and the other indicating completed work.
- A backlog item is considered complete when it is closed or archived, or when it enters a Status value that has been assigned to the Completed reporting category.
| Measure | Description |
|---|---|
| Planned | The height of this bar indicates the number of Backlog Items, or the Total Estimate for Backlog Items, that were Planned for delivery at the end of the first day of the Sprint or Iteration indicated on the X axis. |
| Actual | The height of this bar indicates the number of Backlog Items, or the Total Estimate for Backlog Items, that were completed in the Sprint or Iteration indicated on the X axis. This value is not displayed until after the end of the sprint or iteration |
Configuring the Panel
- To configure the panel, click on the gear icon
 at the top-right corner and click Edit.
 - Choose from the panel parameters below.
Parameters for this panel may differ depending on the location of the dashboard.
| Parameter | Description | Available on these dashboards | Default |
|---|---|---|---|
| Portfolio Item | Only consider Backlog Items for the specified Portfolio Item and all of its child Portfolio Items. | Program | Blank, indicating that you wish to include all Backlog Items. |
| Team | Only consider Backlog Items assigned to the specific Team | Program | All |
| Starting Iteration | Do not show Iterations before the selected Sprint / Iteration. | All other dashboards | First iteration in the schedule |
| Aggregation Type | How results are aggregated. Valid values are Total Estimate and Workitem Count | Program All other dashboards | Total Estimate |