Cumulative Flow by Status Report
This article provides an overview of Cumulative Flow by Status Report.
Overview
The Cumulative Flow by Status chart will report based on roll-up categories anytime it detects multiple Status values definitions. This occur in two scenarios. First, when the project or planning level contains backlog items assigned to one or more teams with a defined process. Second, when the selected project or planning level spans multiple project workspaces with different status values enabled.
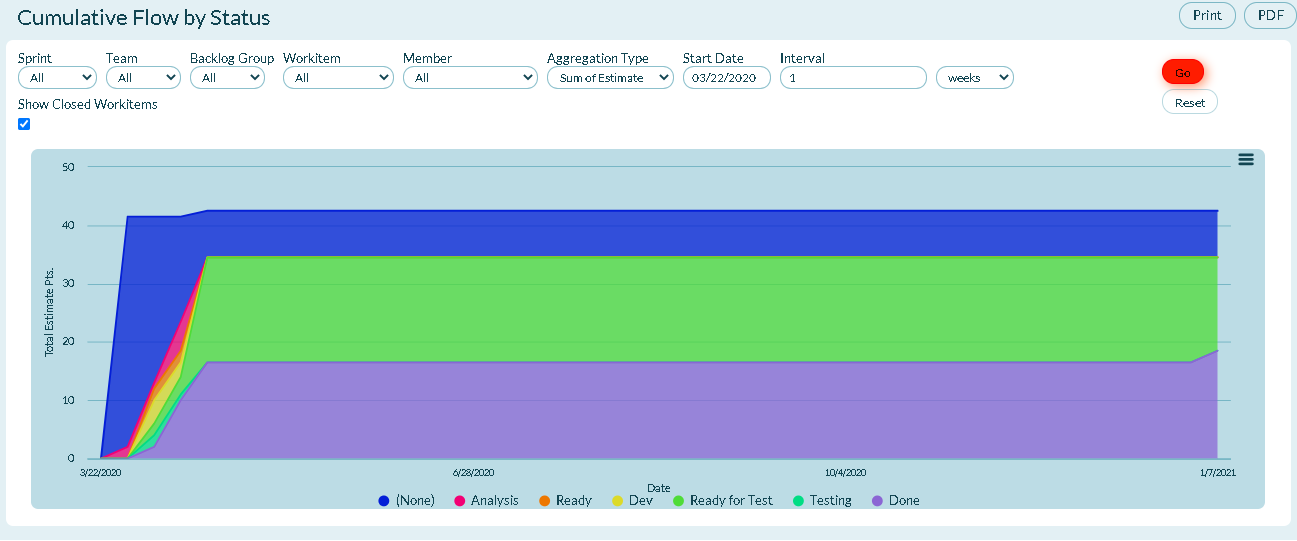
Use it to track the amount of estimate that is in each status category (tested, rework, testing, etc.) as teams work.
Prerequisites
- All Digital.ai Agility trend reports require at least two data points. If not enough data is available, the report may be blank. Depending on the duration you select in the filters, at least one complete period of data must be available to draw a trend line. When selecting days, this means that the minimum duration is actually 2 days, which will include 2 data points.
- Your Show Weekend report settings may affect how much data is selected. For example, if you choose two days as duration and one day is a Saturday or Sunday, and you have elected to not Show Weekends, then you may not have sufficient data to show a trend.
Viewing the Cumulative Flow Report
- Click the hamburger menu
 > Reports> All Reports.
 - In the Sprint or Iteration Reports section, click Cumulative Flow Report.
- Select a project from the Project Navigator.
- Select from the following filters, and then click Go.
Report Filters/Parameters
-
Sprint or Iteration: Shows data assigned to the sprint or iteration. The default value is "All".
-
Team: Shows Team-specific data for the project or program. The default value is "All" or "Blank".
-
Backlog Group: Shows data assigned to the selected backlog group.
-
Workitem: Shows data for a specific work item type: All (all workitems), Stories, Defects, or Testsets. The default option is "All".
-
Member: Shows data assigned to the selected member.
-
Start Date: The first date the report begins calculating data.
-
- For project-based reports, the default start date is the project start date.
- For sprint or iteration-based reports, the default start date is the sprint or iteration start date.
- For member-based reports, the default start date is 13 weeks prior to the current date.
- If the start date is set to the current date or later, no data displays.
-
Interval: The frequency of the data points.
-
By Count: The number of work items in a status.
Technical Details
- The Cumulative Flow report is not automatically bound by any one sprint. The duration sets both the duration of the report and the frequency of the data points. To show daily data points of cumulative flow, set the Start Date to 30 days ago, and set the Interval to 1 days.
If the Team Process Management feature is enabled:
- When filtered to a team that has a defined process, this chart always reports based on the Status values defined for the team.
- When filtered to a team that does not have a defined process, this chart reports based on the Status values defined for selected Project Workspace. If the chart detects distinct Status values enabled in multiple Project Workspaces, it will switch to roll-up categories.
- When filtered to show Backlog Items not assigned to a Team (the "None" team), this chart reports based on the Status values defined for selected Project Workspace. If the chart detects distinct Status values enabled in multiple Project Workspaces, it will switch to roll-up categories.
- When filtered to show all Backlog Items regardless of Team (the "All" team), the Cumulative Flow by Status chart reports based on roll-up categories, unless the chart detects that all Status are enabled in the Project Workspaces.