Backlog Item Velocity by Type Report
This article explains how to view the report for Backlog Item Velocity.
Overview
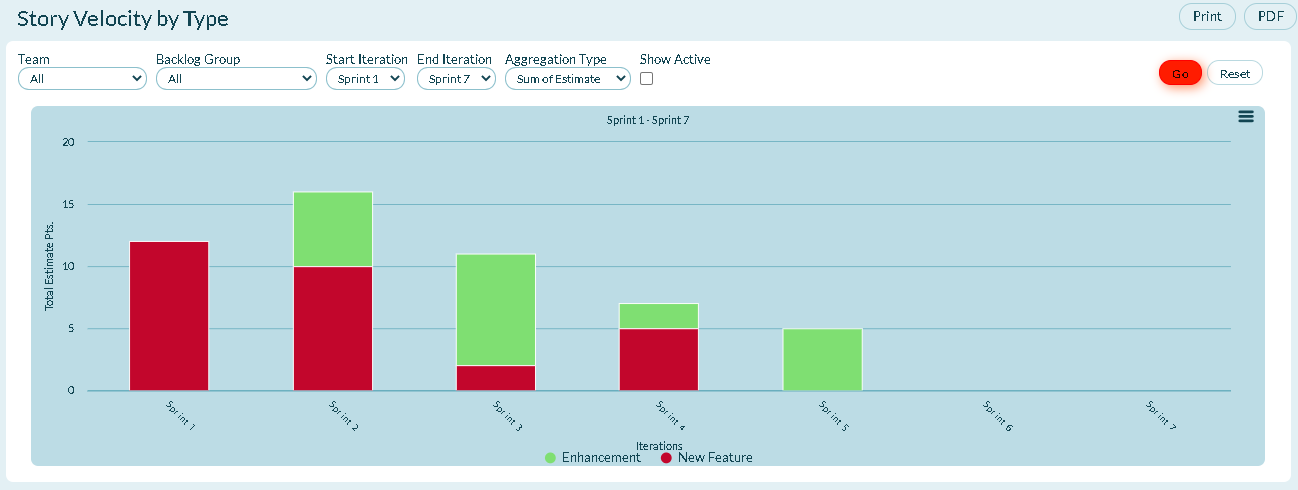
The Backlog Item Velocity by Type report is a bar chart that shows the total Estimate broken down by type delivered over a specified date range (days, weeks, or months) during a sprint or iteration and rolls up velocity across different sprint schedules.
Accessing This Report
- Click the hamburger menu
 > Reports > All Reports.
 - Scroll down to the Planning Reports section and click Story Velocity by Type.
- Select from the filters below, and then click Go.
Report Filters or Parameters
-
Team: Shows Team-specific data for the project or program. The default value is "All" or "Blank".
-
Backlog Group: Shows data assigned to the selected backlog group.
-
Start Sprint or Iteration: The first sprint or iteration you want to include in the report.
-
End Sprint or Iteration: The last sprint or iteration you want to include in the report.
-
Aggregation Type: Determines how the data is aggregated. Valid values are:
-
- Sum of Estimate - Sum of the Estimate values.
- Workitem Count - Count of work items regardless of estimate value.
- Show Active: Show active items on the report.
Technical Details
- By default, the date range is set to the beginning and ending dates of the project and the duration is set to measure by weeks.
- If the project has no end date, the end date defaults to the current date.