Interpret Increment Scheduling Progress Bars
Progress bars on the Increment Scheduling page provide a visual representation of capacity and workload at both the project and team levels. Use these indicators to quickly assess work completion, identify capacity issues, and track targets.
Permission requirement: Viewing progress bars requires read access to projects, increments, and teams. Configuring target values (Target Swag, Target Estimate Points, Target Velocity) that determine progress bar calculations requires Project Admin role.
Who Interprets Progress Bars
Progress bar monitoring supports data-driven planning decisions:
- Product Owners monitor completion bars to track closed versus remaining work and assess whether increments are on track for delivery.
- Program Managers scan progress bars across multiple projects to identify capacity issues, under-utilized teams, and schedule risks.
- Scrum Masters use time indicator triangles to compare time elapsed against work completion, flagging potential schedule slippage during standups.
- Portfolio Managers review orange-striped bars indicating exceeded targets to make descoping or resource reallocation decisions.
Key Capacity Indicators
Progress bars display:
- Completed vs. Remaining Work: Visual breakdown of closed and open work items
- Capacity Allocation: How much work is scheduled relative to team capacity
- Target Values: Either Target Swag or Target Estimate Points, depending on your estimation method
- Risk and Value Rollups: Aggregated portfolio item measures (if configured)
- Time Progress: Percentage of increment duration elapsed
Access Increment Progress Bars
To view progress bars:
- Click the hamburger menu
 > Increment > Increment Scheduling.
 - Select a project or increment from the Project Navigator.
- Click an increment, then select a tab to view progress bars.
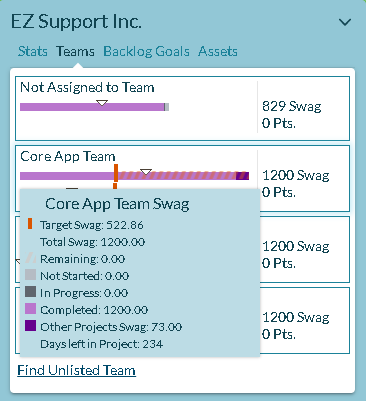
- Hover over any progress bar to see detailed status information.
Result: The tooltip displays Target Swag/Estimate Points, Total, Remaining, Other Projects allocation, and Days Left in the increment.
How Progress Bars Work
Dynamic Sizing
- Bar width is proportional to Swag or Estimate Points values
- Relative scaling adjusts all bars when the largest increment changes
- Dual bars separate Swag (top) from Estimate Points (bottom), allowing feature-level planning with Swag before story-level breakdown with Estimate Points
Display Logic
Swag is displayed when:
- A Target Swag value exists for the increment, OR
- Portfolio Items with Swag values are assigned to the increment
Otherwise, Estimate Points are displayed.
If neither Swag nor Estimate Points are defined for an increment, the Target Indicator (vertical orange bar) does not appear.
Progress Bar Color Key
Status Indicators
| Symbol | Meaning |
|---|---|
| Vertical Orange Bar (Target Indicator) | Shows Target Swag (if Swag is displayed) or Target Estimate Points (if Estimate Points are displayed) |
| Time Indicator Triangle | Shows percentage of time elapsed in the increment. Starts at the left edge on day one and reaches the right edge on the last day. Compare this to work completion to assess schedule adherence. Note: Does not display if no end date is set. |
Completion and Capacity Bars
| Bar Color/Pattern | Meaning |
|---|---|
| Blue Bar | Closed Estimate Points |
| Purple Bar | Closed Swag |
| Gray Bar | Remaining (Open) Swag or Estimate Points |
| White and Gray Stripes | Available capacity for additional work |
| Orange Stripes | Exceeded target: planned work exceeds the set target |
Team-Level Capacity (Team Details Section Only)
| Bar Color/Pattern | Meaning |
|---|---|
| Dark Blue Bar | Additional Estimate Points allocated to the team from other projects or increments in the same timeframe (Digital.ai Agility Teams only). This work may impact current increment plans. |
Monitor Capacity Health
Use progress bars to identify:
- Under-capacity: White/gray striped areas indicate room for more work
- Over-capacity: Orange striped areas indicate work exceeds target capacity
- Schedule risk: Time Indicator ahead of completion bar suggests schedule slippage
- Cross-project conflicts: Dark blue bars (Team Details) show competing work allocation
Troubleshooting
Why don't I see the vertical orange bar (Target Indicator)?
The Target Indicator requires setting Target Swag or Target Estimate Points for the project or increment. Open the project settings and enter these values to display the target line. See Plan Increment Capacity for configuration details.
Why doesn't the Time Indicator Triangle appear?
The Time Indicator requires Begin Date and End Date set for the increment. Open the project or increment settings and enter both dates to display the time progress triangle.
What does the orange striped pattern mean and how do I fix it?
Orange stripes indicate planned work exceeds your target capacity (Target Swag or Target Estimate). To resolve: (1) Remove lower-priority work items from the increment, (2) Increase the target capacity if initial estimates were conservative, or (3) Extend the increment timeline if feasible.
Why do I see dark blue bars in the Team Details section?
Dark blue bars show work allocated to the team from other projects or increments during the same timeframe. This indicates potential resource conflicts. Review the team's commitments across all projects to identify and resolve overallocation.
Related Topics
Project or Increment Burndown Report
Cumulative Flow by Status Report