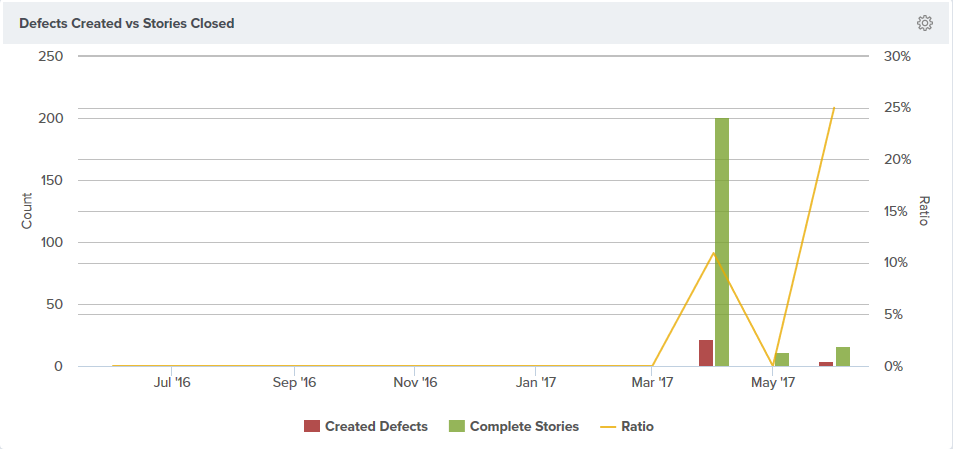
Defects Created vs Backlog Items Closed Dashboard Panel
This artilce provides an overvie of the Defects Created vs Backlog Items Closed Dashboard Panel in Agility.
The Analytics Defects Created vs Backlog Items Closed dashboard panel provides visibility into trends on Backlog Item Completion and Defect Creation over a given period of time.

Accessing this Panel
- Click the hamburger menu
> Analytics.
- Click on the Enterprise tab.
- If the panel is not visible, click the Add Panel button.
- In the Add Panels window, click the Add button for the panel and click Done. The panel should display on the dashboard.
- To configure the panel, click on the gear icon
at the top-right corner and click Edit.
Measures
In the bar chart portion of this chart, measured on the left Y-Axis, there is a bar indicating how many Defects were created and a separate bar indicating how many Stories were completed in each time period.
In the line chart portion of this chart, measured on the right Y-Axis, we need the ratio between these two measures.
Panel Parameters
To configure the panel, click on the gear icon at the top-right corner and click Edit.
The following table describes each panel parameter.
| Parameter | Description | Default |
|---|---|---|
| Project | Select a specific Project, or Planning Level, to be considered | All |
| Program | Select a specific Program to be considered | None |
| Interval | The period for grouping data. Valid values are - Monthly - Quarterly | Monthly |
| Number of years to consider | Then number of previous years to be considered. | 1 |
| Completed Vs. Closed | Which Date to use when considering Stories for this panel. - Complete Date - Closed Date | Complete |