Project Burndown by Iteration Dashboard Panel
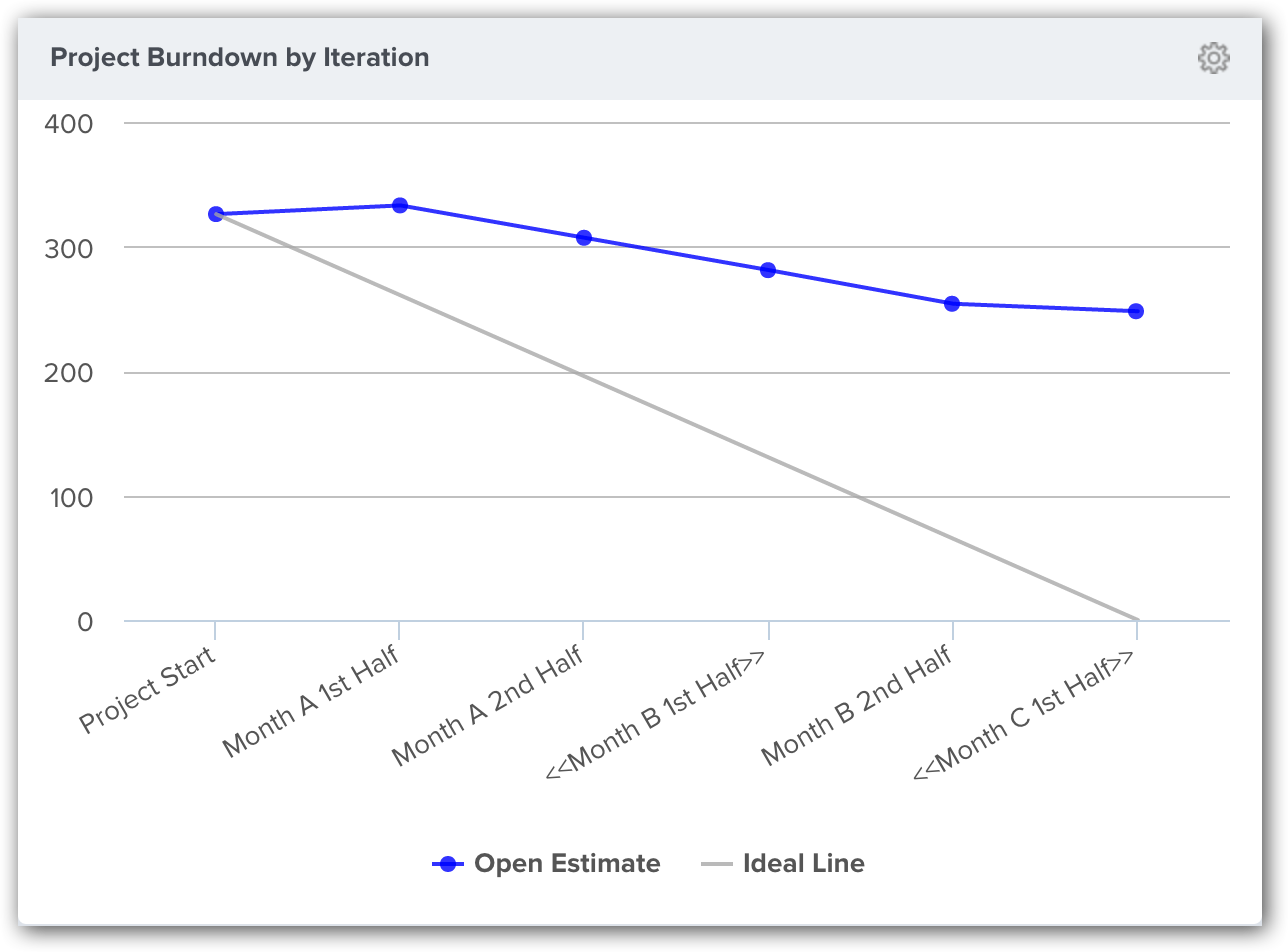
The Analytics Project Burndown by Iteration dashboard panel shows a line chart that indicates the total amount of open estimate remaining at the end of each iteration. The x-axis contains a mark representing the end of each iteration. Each point on the chart represents how much open estimate remained at the end of the iteration.
There are two additional parameters for this panel. The first is a check-box labeled, HIP Iteration. When selected, the chart reserves the last iteration for hardening, integration, and planning. The other parameter allows you to specify the number of story points you expect to complete. This allows you to specify the total number of points you expect to complete in this project. When this value is 0, the panel calculates the total number of points based on what was planned on the first day of the project. This light gray line is referred to as the planned line. To calculate the points on this line, we divide the Planned Points value by the number of iterations identified. If the HIP Iteration is selected, we reduce iteration count by one.

Configuring Dashboard Parameters
To further configure the data shown in the dashboard, click on the gear icon at the top-right corner of the dashboard panel, click Edit, and select the report parameters.
Where to Find This Panel
This panel is available on any of the following Analytics dashboards:
- Portfolio > Executive Dashboard
- Program > Product Owner Dashboard
- Team > Dashboard
- Team > Team Dashboard
- Team > Quality Dashboard
- Team > ScrumMaster Dashboard
If the panel is not visible, you can add it following the instructions in Adding a Panel to a Dashboard.