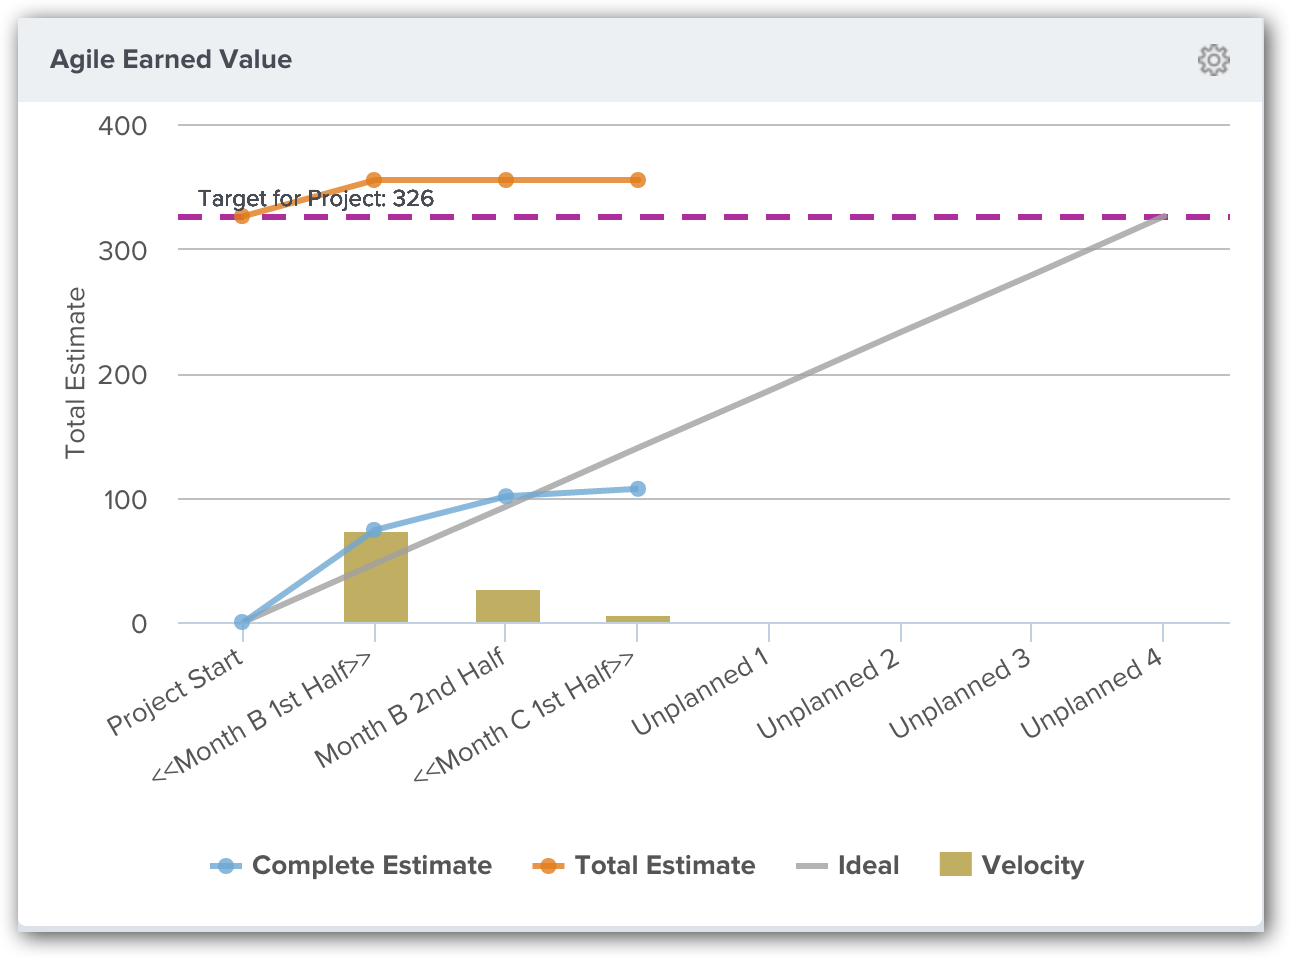
Agile Earned Value Dashboard Panel
This topic explains the Agile Earned Value Dashboard Panel in Agility.
Overview
The Analytics Agile Earned Value dashboard panel enables the comparison of targeted, or baselined, work in a project to what is actually planned and what has been delivered in each iteration. The chart also includes a bar graph indicating the velocity in each sprint. Use the Agile Earned Value panels as an agile environment alternative to traditional Earned Value reporting.
Because each data point in this panel represent a Sprint or Iteration, the panel requires a schedule. If the project does not contain a schedule, the panel will not display any results.

Where to Find This Panel
This panel is available on any of the following Analytics dashboards:
- Portfolio > Executive Dashboard
- Team > Dashboard
- Team > Team Dashboard
- Team > Quality Dashboard
- Team > ScrumMaster Dashboard
If the panel is not visible, you can add it following the instructions in Adding a Panel to a Dashboard.
Measures
- Target for Project. The Target, or baselined, total for the selected project. This value is set in the panel parameters, but defaults to the value set in the Target Estimate field for the selected project. If that value is not specified, the default is the total estimate on the first day of the project.
- Complete. This line indicates the total amount of project work completed at the end of each iteration.
- Total. This line indicates the total amount of work defined in the project on the first day of the project and at the end of each iteration.
- Ideal. This line indicates how much work needs to be delivered in each iteration in order to deliver the target estimate in the specified number of iterations.
- Velocity. This bar represents the total amount of work completed in the time frame defined by the iteration.
The units for each of these is the same and is are based on the aggregation type selected in the panel parameters.
Configuring the Panel
On all Dashboards, the Project and Program Dashboard parameters effect the results of the query used to populate this chart.
When this panel is on the Role Based Dashboards (indicated with an * above), the query for this panel also honors the following Dashboard parameters
- Start Date
- Work Item
- Team
- Backlog Group
- Objective
- Portfolio Item
- Click on the gear icon
at the top-right corner of the dashboard panel and click Edit.
- Choose from the panel parameters below.
Parameters for this panel may differ depending on the location of the dashboard.
Panel Parameter Descriptions
- Portfolio Item: Shows work items in the selected portfolio item and all of it's children. The default option is "Blank" and shows all work items.
- Team: Shows Team-specific data for the project or program. The default value is "All" or "Blank".
- Backlog Group: Shows work items in the selected backlog group. The default option is "All".
- Backlog Goal or Objective: Shows work items assigned to the selected backlog goal. The default option is "All".
- Workitem: Shows data for a specific work item type: All (all workitems), Backlog Items, Defects, or Testsets. The default option is "All".
- Sprint or Iteration Count: Displays the total number of sprints or iterations where work is assigned.
- Target: The amount of work items expected for delivery (also called the Baseline value). The number must be in specified in the units used by the aggregation type. The default value is the value in the Target Estimate attribute on the Project. If blank, the default value is the total estimate in the project on the Start Date.
- Aggregation Type: Determines how the data is aggregated. Valid values are:
- Total Estimate - Sum the Estimate values.
- Workitem Count - Count of work items regardless of estimate value.