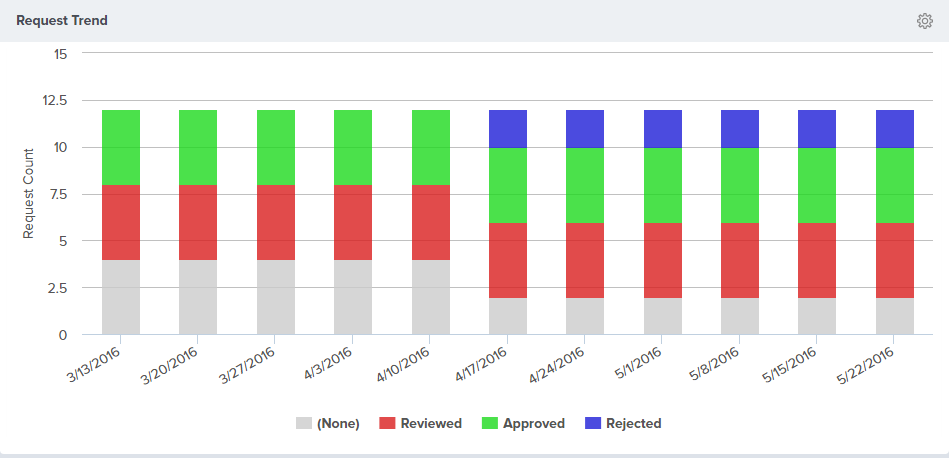
Request Trend Dashboard Panel
The Analytics Request Trend dashboard panel allows you to understand how requests in the selected project or program have changed over time.

Where to Find This Panel
The Request Trend Dashboard panel is available on any of the following Analytics dashboards.
- Portfolio > Executive Dashboard
- Program > Dashboard
- Program > Product Owner Dashboard
- Team > Team Dashboard
- Team > Quality Dashboard
- Team > ScrumMaster Dashboard
Measures
- The height of each bar on this chart indicates the number of requests in the selected state, for the project or program specified, on a given date.
- The start date is determined by the panel Start Date parameter.
- The number of days (bars), is determined by the duration size parameter.
- The frequency between dates is determined by the duration unit panel parameter.
- Requests are grouped by Type.
Configuring the Panel
- To configure the panel, click on the gear icon
at the top-right corner and click Edit.
- Choose from the panel parameters below.
Parameters for this panel may differ depending on the location of the dashboard.
| Parameter | Description | Available on these dashboards | Default |
|---|---|---|---|
| Start Date | The Date to begin collecting data | Program | Start Date value from the project. |
| Duration Size | The number of Duration Units until the Project Ends | Program | - If the project has an End Date, Duration Size defaults to the difference between the Start and End Dates in Weeks. - If the Project has no End Date, Duration Size defaults to the difference between the Start Date and the current date. Duration Size will be set to 0 if the calculation results in a negative number. |
| Duration Unit | How a period is determined. Valid values are Weeks and Months. | Program | Weeks |
| Request State | Which Request to consider. Valid values are: Open. Requests that are Open or Active Closed. Requests that are Closed or Archived. All. All Request regardless of Reporting Category | Program All other dashboards | All |