Repositioning a Dashboard Panel
This article explains how to reposition a dashboard panel in Agility.
Accessing a Dashboard
- Click the hamburger menu
 > Analytics.
 - Click on a dashboard tab (Enterprise, Portfolio, Program, or Team).
- Choose a Project and a Program (if available).
The Project drop-down list shows all the projects available to you within the project hierarchy. The Program drop-down list only displays if your Digital.ai Agility instance contains any programs. The values shown are controlled by the selected project. After you choose a project, the program list is automatically populated with the programs available to the selected project, or any of it's children. If the project is higher in the hierarchy, you will see many programs.
Each dashboard panel will automatically be populated with default data from the selected project. To customize the data, see Configuring a Panel below.
Adding a Panel to a Dashboard
- Click the hamburger menu > Analytics.
- Click on a dashboard tab (Enterprise, Portfolio, Program, or Team).
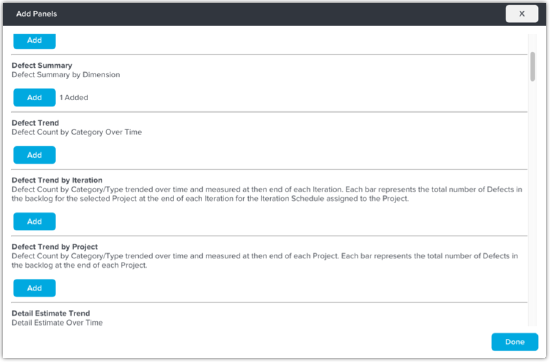
- Click the Add Panel button.
- In the Add Panels window, click the Add button for each panel, and click Done to return to the dashboard.
After adding a panel, you can configure the data by selecting the panel parameters.
Configuring Dashboard Panel Parameters or Filters
By default, each Analytics dashboard panel shows data based on the selected project. Follow the steps below if you want to customize the data displayed in the panel by selecting you can choose the specific panel parameters (filters) following the steps below.
- Click on the
 in the top right corner of a panel and click Edit.
 - In the Edit window, select the desired panel parameters and click Done.
Note that charts are configured independently. This is helpful if, for example, you want to add the same chart for each team working on the project.
Enlarging a Panel
To view a larger version of the same chart and panel details, click on the panel image. A separate window opens to show a larger image and all the filtering options available so you can further refine the data. Where appropriate you can drill-through these charts to a grid of the actual data. These larger charts can be exported to PDF, emailed, or exported to Microsoft Excel.
Renaming a Panel
Follow these steps to change the name of a panel to better identify the data shown.
- Click on the in the top right corner of a chart and click Rename.
- Enter the new chart name in title field, and then press the Enter key on your keyboard.
Repositioning a Panel
To change the position of a chart on a the page, simply drag and drop it to a new location.
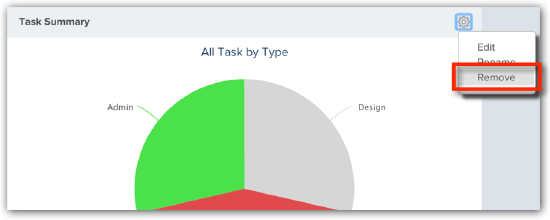
Removing a Panel
To remove a chart, click on the ![]() in the top right corner of a chart, and click Remove.
in the top right corner of a chart, and click Remove.