Project Burndown Monte Carlo Simulation Dashboard Panel
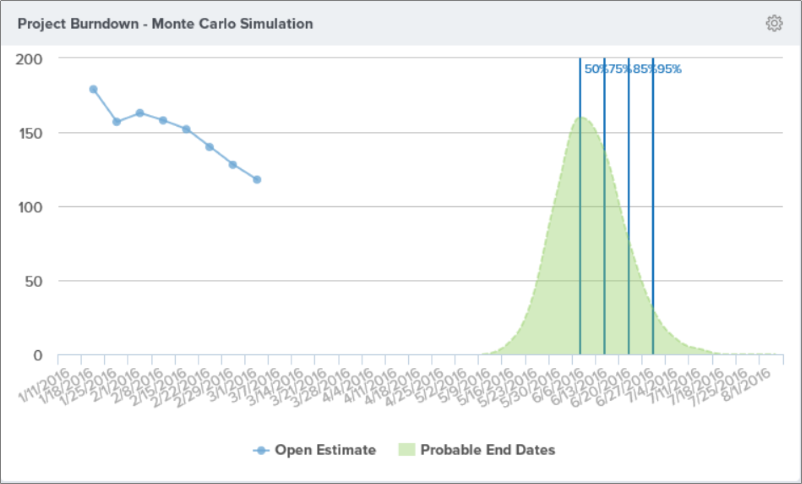
The Analytics Project Burndown Monte Carlo Simulation dashboard panel shows the historical project burndown values just like the regular Project Burndown panel. However, this panel shows probable delivery dates based on a Monte Carlo Simulation using the historical slope value from the Burndown line. A simulation start date allows you to bypass fluctuations in scope that typically occur as a project ramps up.
The probable delivery dates are annotated to indicate where the 50 percentile, the 75 percentile, the 85 percentile, and the 95 percentile values occur. The default is the start date on the selected project, but you can change it in the panel parameters.
Configuring Dashboard Parameters
To further configure the data shown in the dashboard, click on the gear icon![]() at the top-right corner of the dashboard panel, and click Edit to configure the report parameters.
at the top-right corner of the dashboard panel, and click Edit to configure the report parameters.
Where to Find This Panel
This panel is available on any of the following Analytics dashboards:
- Portfolio > Executive Dashboard
- Program > Dashboard
- Program > Product Owner Dashboard
- Team > Dashboard
- Team > Team Dashboard
- Team > ScrumMaster Dashboard
If the panel is not visible, you can add it following the instructions in Adding a Panel to a Dashboard.
Measures
The Monte Carlo Simulation panel shows the following information.
Hover over any point on these lines to display the value on a specific date.
| Value | Description |
|---|---|
| Open Estimate | The blue line indicates the total open estimate value, or the total backlog item count, for the select project or program and all child nodes. |
| Probable End Dates | The dashed green line and the distribution curve on the right indicate possible end dates based on a Monte Carlo simulation of the remaining delivery based on historical delivery. The height of the curve for a given date indicates how many times that date is selected as the end date in the simulation. Probable End Dates are calculated based on historical delivery. If your Open Estimate line is flat, or has large flat segments, then it is not possible to calculate probable end dates. |
| Percentile or Confidence Markers | The blue vertical lines with percentage labels indicate possible delivery dates. The value (50, 75, 85, 95) indicates the percentile of the results for that date. For example, the date with the 50% label indicates the date representing the 50th percentile. On this date 50% of the simulation results were before the date and 50% were after. |