Project Burndown Dashboard Panel
The Analytics Project Burndown dashboard panel allows you to visualize the progress of a Project or Program. It can also provide a forecasted end date based on a user-selected linear forecast algorithm.
Where to Find This Panel
The Project Burndown dashboard panel is available on any of the following Analytics dashboards.
- Portfolio > Executive Dashboard
- Program > Dashboard
- Program > Product Owner Dashboard
- Team > Dashboard
- Team > Team Dashboard
- Team > Quality Dashboard
- Team > ScrumMaster Dashboard
Measures
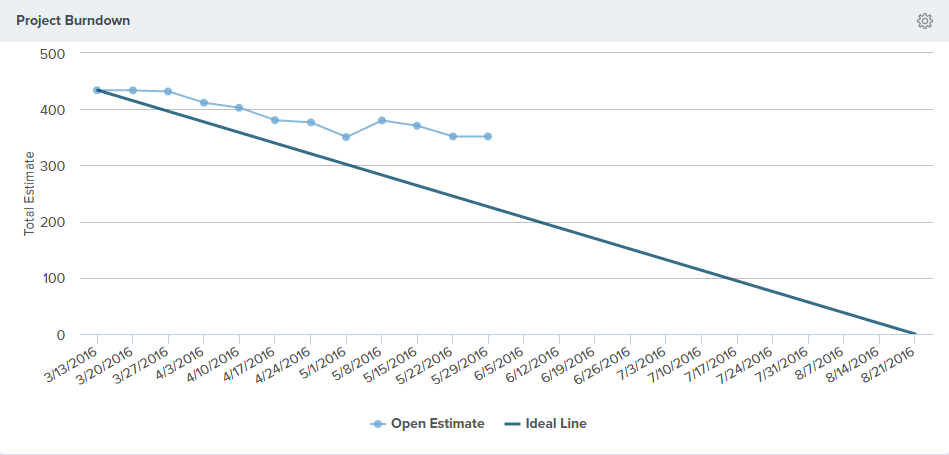
The following information is visible in this panel. Hovering over any point on these lines displays the value on that date.
| Value | Description |
|---|---|
| Open Estimate | The solid blue line indicates the total open estimate value, or the total backlog item count, for the backlog items in the selected project or program and all child projects. |
| Ideal Line | A linear forecast line from the Start Date to the End Date calculated based on input parameters. The Start Date value is the largest value observed in the series. |
| Forecast | The blue dashed line indicates the forecasted open estimate value, or the open backlog item count value. This line is only visible if you selected a forecast option. |
Configuring the Panel
- To configure the panel, click on the gear icon
 at the top-right corner and click Edit.
 - Choose from the panel parameters below.
Parameters for this panel may differ depending on the location of the dashboard.
Panel Parameter Descriptions
- Portfolio Item: Shows work items in the selected portfolio item and all of it's children. The default option is "Blank" and shows all work items.
- Team: Shows Team-specific data for the project or program. The default value is "All" or "Blank".
- Backlog Group: Shows work items in the selected backlog group. The default option is "All".
- Backlog Goal or Objective: Shows work items assigned to the selected backlog goal. The default option is "All".
- Workitem: Shows data for a specific work item type: All (all workitems), Backlog Items, Defects, or Testsets. The default option is "All".
- Start Date: The first date the report begins calculating data.
- For project-based reports, the default start date is the project start date.
- For sprint or iteration-based reports, the default start date is the sprint or iteration start date.
- For member-based reports, the default start date is 13 weeks prior to the current date.
- If the start date is set to the current date or later, no data displays.
- Duration Size: The number of Duration Units until the project ends. If the project has an end date, the Duration Size defaults to the difference between the Start and End Dates in weeks. If the project has no End Date, the Duration Size defaults to the difference between the Start Date and the current date. Duration Size is set to 0 if the calculation results in a negative number.
- Interval: The period (monthly or quarterly) for grouping the throughput data used for the calculation.
- Forecast: Forecast a single possible end date using linear forecasting based on the following historical value:
- None. Do not forecast an end date.
- Average. Use the average of all visible slope values.
- Optimistic. Use the steepest visible slope value.
- Pessimistic. Use the lowest, non-zero, visible slope value.
- Most Often. Use the visible non-zero slope value that occurs most often. If no slope value occurs more frequently than any other, use the average.
- Aggregation Type: Determines how the data is aggregated. Valid values are:
- Total Estimate - Sum the Estimate values.
- Workitem Count - Count of work items regardless of estimate value.