Portfolio Item Throughput Dashboard Panel
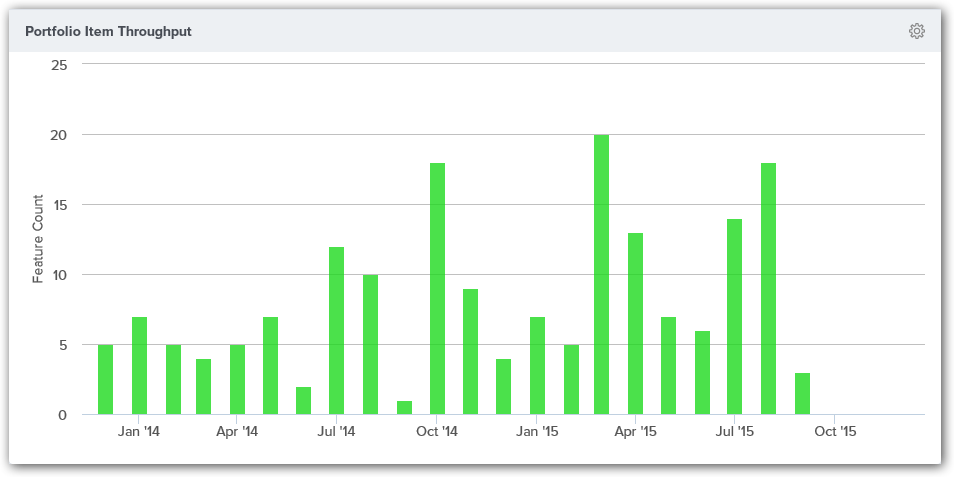
The Analytics Portfolio Item Throughput dashboard panel indicates how many Portfolio Items were closed in a given time period. Each bar is grouped by Portfolio Item Type ( Backlog Item, Defect, TestSet).
Accessing this Panel
- Click the hamburger menu
 > Analytics.
 - Click on the Enterprise tab.
- If the panel is not visible, click the Add Panel button.
- In the Add Panels window, click the Add button for the panel and click Done. The panel should display on the dashboard.
- To configure the panel, click on the gear icon
 at the top-right corner, and click Edit.
Measures
Each bar on this panel indicates the total number of Portfolio Items that were Closed in the period indicated on the x-axis. Each bar is grouped by Portfolio Item type. You can focus on a specific type of Portfolio Item by using the legend you can turn off other types.
Panel Parameters
To configure the panel, click on the gear icon ![]() at the top-right corner, and click Edit. The following table describes each panel parameter.
at the top-right corner, and click Edit. The following table describes each panel parameter.
| Parameter | Description | Default Value |
|---|---|---|
| Interval | The period for grouping data. Valid values are: - Monthly - Quarterly | Monthly |
| Number of years to look at data | Then number of previous years to consider. | 1 |
| Type | The Type of Portfolio Items to consider | All |