Portfolio Item Responsiveness Dashboard Panel
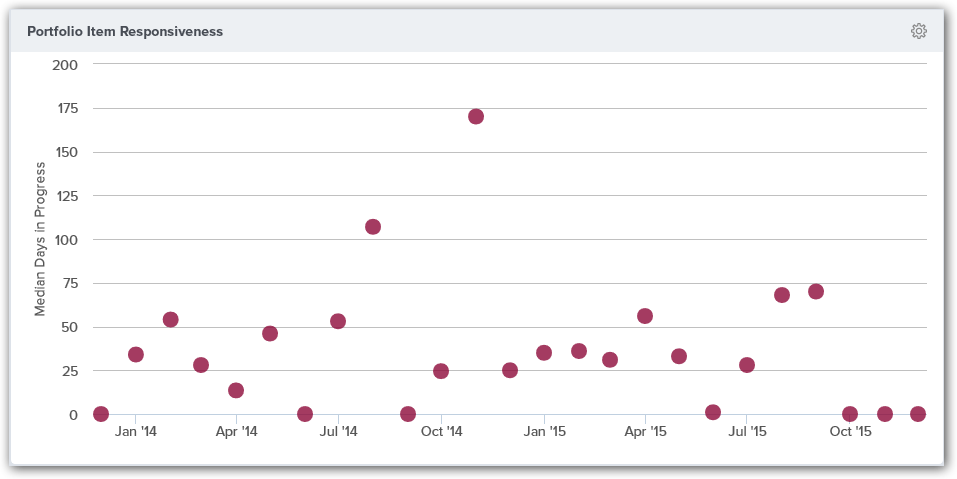
The Analytics Portfolio Item Responsiveness dashboard panel trends the average amount of time Portfolio Items spend "In Progress".

Accessing this Panel
- Click the hamburger menu
> Analytics.
- Click on the Enterprise tab.
- If the panel is not visible, click the Add Panel button.
- In the Add Panels window, click the Add button for the panel and click Done. The panel should display on the dashboard.
- To configure the panel, click on the gear icon
at the top-right corner and click Edit.
Measures
Each dot on the scatter plot represents the "average" amount of time all Portfolio Items Closed in the X-Axis time period spent in a Status Value assigned to the "In Progress" Reporting Category.
The "average" calculation can be one of the following:
- Mean - The simple average.
- Median - The vale that is half way through a set of values when arranged in ascending order.
- Mode - the most common or most occurring value in a series. If a mean value cannot be determined, the Mean is used.
Panel Parameters
To configure the panel, click on the gear icon at the top-right corner and click Edit.
The following table describes each panel parameter.
| Parameter | Description | Default |
|---|---|---|
| Interval | The period for grouping data. Valid values are - Monthly - Quarterly | Monthly |
| Aggregation Method | The formula to use for calculating the "average". Valid values are - Median - Mode - Average | Average |
| Number of years to consider | Then number of previous years to be considered. | 1 |
| Type | The Type of Portfolio Item to consider | All |