Portfolio Item Predictability Dashboard Panel
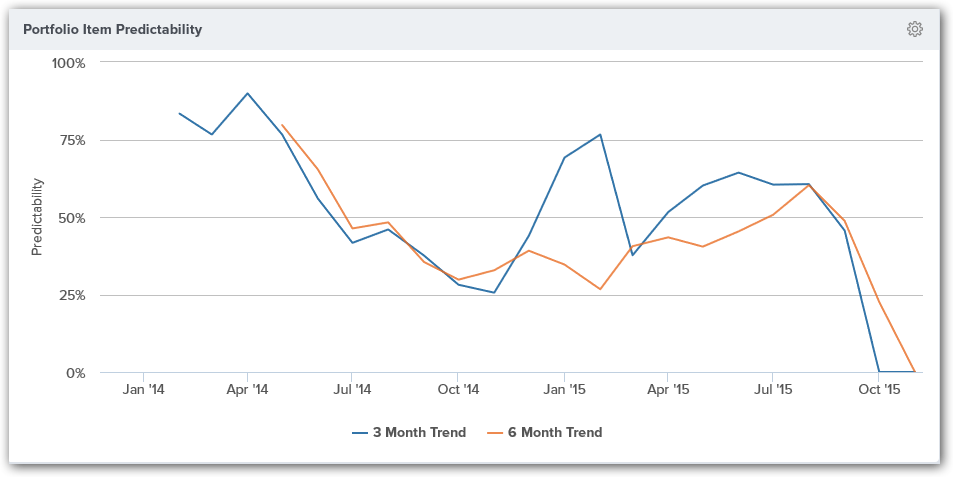
The Analytics Portfolio Item Predictability dashboard panel indicates historical trends of Portfolio Item Throughput variation. The more consistent your Portfolio Item Throughput values are period over period the higher the predictable score.
Accessing this Panel
- Click the hamburger menu
 > Analytics.
 - Click on the Enterprise tab.
- If the panel is not visible, click the Add Panel button.
- In the Add Panels window, click the Add button for the panel and click Done. The panel should display on the dashboard.
- To configure the panel, click on the gear icon
 at the top-right corner and click Edit.
Measures
This panel measures the coefficient of the root mean squared variation of the Portfolio Item Throughput values moth-over-month or quarter-over-quarter for 3 month per quarter and 6 month per quarter intervals.
Panel Parameters
To configure the panel, click on the gear icon ![]() at the top-right corner and click Edit.
at the top-right corner and click Edit.
The following table describes each panel parameter.
| Parameter | Description | Default |
|---|---|---|
| Interval | The period for grouping the Throughput data used for the calculation. Valid values are - Monthly - Quarterly | Monthly |
| Number of years to look at data | Then number of years back to consider | 1 year |
| Type | The Type of Portfolio Item to consider | All |