Portfolio Item Burn Up Monte Carlo Simulation Dashboard Panel
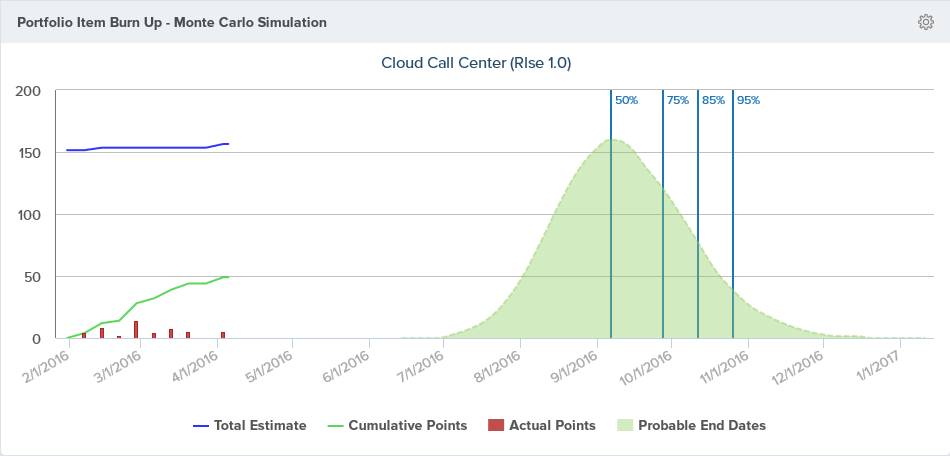
The Analytics Portfolio Item Burn Up-Monte Carlo Simulation dashboard panel shows the possible delivery dates for work in the selected portfolio item.
Where to Find This Panel
You can add Monte Carlo Simulation panels to any of the following Analytics dashboards.
- Portfolio > Dashboard
- Portfolio > Executive Dashboard
- Program > Dashboard
- Program > Product Owner Dashboard
- Team > Team Dashboard
- Team > Quality Dashboard
- Team > ScrumMaster Dashboard
Measures
The Monte Carlo Simulation panel shows the following information.
Hover over any point on these lines to display the value on a specific date.
| Value | Description |
|---|---|
| Total Value | The solid blue line indicates the total estimate value, or the total backlog item count, for the backlog items associated with the portfolio item and all child portfolio items. |
| Cumulative Value | The solid green line (on the left) indicates the total closed estimate value, or the total closed backlog item count, for the backlog items associated to the selected portfolio item and all child portfolio items. |
| Actual Value | The dark red bars indicate how much estimate, or the number of backlog items, was closed in the given period. |
| Probable End Dates | - The dashed green line and the distribution curve on the right indicate possible end dates based on a Monte Carlo simulation of the remaining delivery based on historical delivery. -The height of the curve for a given date indicates how many times that date is selected as the end date in the simulation. Probable End Dates are calculated based on historical delivery. If your Cumulative Value line is flat, or has large flat segments, then it is not possible to calculate probable end dates. |
| SWAG Value | If enabled, the light red line indicates the Swag value for the selected portfolio item. This value does not include the SWAG value of child portfolio items. |
| Percentile or Confidence Markers | The blue vertical lines with percentage labels indicate possible delivery dates. The value (50, 75, 85, 95) indicates the percentile of the results for that date. For example, the date with the 50% label indicates the date representing the 50th percentile. On this date 50% of the simulation results were before the date and 50% were after. |
Configuring the Panel Parameters
The parameters for this panel are the same for all dashboards on which it is available.
- To configure the panel, click on the gear icon
 at the top-right corner and click Edit.
 - Select any of the following parameters.
| Parameter | Description | Default |
|---|---|---|
| Portfolio Item | The portfolio item to forecast. | Blank. You must supply this parameter. |
| Start Date | The first date of the historical data. | The start date of the selected portfolio item. |
| Simulation Start Date | The first date to consider when running the Monte Carlo simulation. Frequently, work for a Portfolio Item will sit idle for a while before work begins in earnest. Using this parameter, you can skip the weeks where no work was performed. | The Start Date of the selected Portfolio Item |
| Interval | How frequently to measure change. Valid values are Weekly and Monthly. | Weekly |
| Include SWAG | Include the Portfolio Item SWAG value on the chart | Not checked. Indicating that you do not want to show the SWAG value. |
| Aggregation Type | How to Aggregate the historical data. The options are: Total Estimate - - Use the sum of the Backlog Item Estimate value when querying data for the simulation input With this option, Backlog Items that do not have an Estimate are not considered. Workitem Count - - Use a count of Backlog Items when querying data for the simulation input. With this option Backlog Items that do not have an Estimate are considered. | Total Estimate |