Portfolio Item Burn Up Dashboard Panel
The Analytics Portfolio Item Burn Up dashboard panel allows you to visualize the progress of an individual portfolio item. It can also provide a forecasted end date based on a user-selected linear forecast algorithm.
Where to Find This Panel
You can add Portfolio Item Burnt Up panels to any of the following Analytics dashboards.
- Portfolio > Dashboard
- Portfolio > Executive Dashboard
- Program > Dashboard
- Program > Product Owner Dashboard
- Team > Team Dashboard
- Team > Quality Dashboard
- Team > ScrumMaster Dashboard
Panel Measures
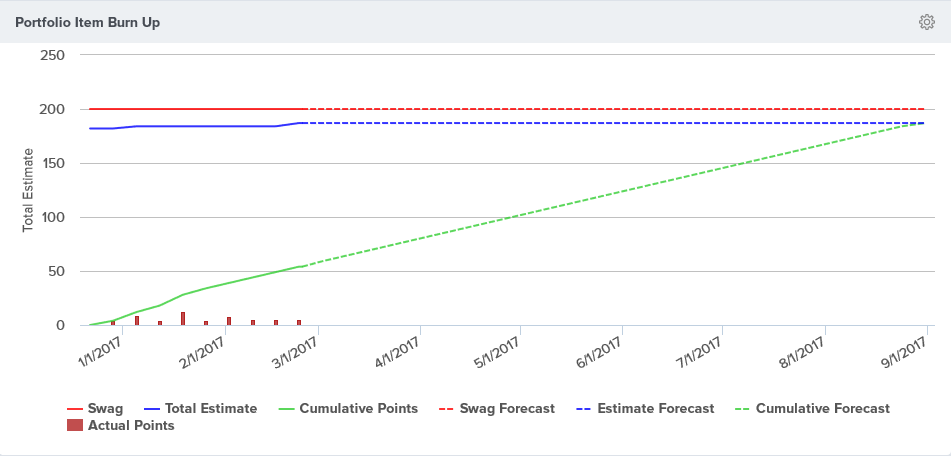
The following information is visible in this panel. Hovering over any point on these lines displays the value on that date.
| Value | Description |
|---|---|
| Total Value | The solid blue line indicates the total estimate value, or the total backlog item count, for the backlog items associated to the selected portfolio item and all child portfolio items. |
| Cumulative Value | The solid green line (on the left), indicates the total closed estimate value, or the total closed backlog item count, for the backlog items associated to the selected portfolio item and all child portfolio items. |
| Actual Value | The dark red bars indicates how much Estimate, or how many Backlog Items, were closed in the given period. |
| SWAG Value | If enabled, the light Red line indicates the Swag value for the selected portfolio item. This value does not includes the SWAG value of child portfolio items. |
| Total Forecast | The blue dashed line indicates the forecasted total estimate value, or the total backlog item count value. This line is only visible if you selected a forecast option. |
| Cumulative Forecast | The green dashed line indicates the forecasted total closed estimate value, or the total closed backlog item count value. This line is only visible if you selected a forecast option. |
Configuring Panel Parameters
To configure the panel, click on the ![]() icon in the top right corner and click Edit. The following table describes each panel parameter.
icon in the top right corner and click Edit. The following table describes each panel parameter.
The parameters for this panel are the same for all dashboard where the panel is located.
| Parameter | Description | Default |
|---|---|---|
| Portfolio Item | The Portfolio Item to forecast. | Blank. You must supply this parameter. |
| Start Date | The Date to begin measurements for the selected Portfolio Item. | The Start Date value on the selected Portfolio Item or the Start Date of the containing Project. |
| End Date | The anticipated delivery Date for the selected Portfolio Item | The End Date Value on the selected Portfolio Item or the End Date of the containing Project, or Today. |
| Include SWAG | Include the Portfolio Item SWAG value on the chart | Not checked. Indicating that you do not want to show the SWAG value. |
| Forecast | Forecast a single possible end date using linear forecasting based on the following historical value: - None. Do not forecast an end date. - Average. Use the average of all visible slope values. - Optimistic. Use the steepest visible slope value. Pessimistic. Use the lowest, non-zero, visible slope value. - Most Often. Use the visible non-zero slope value that occurs most often. If no slope value occurs more frequently than any other, use the average. | None |
| Aggregation Type | Indicates how to aggregate the historical data. The options are: - Total Estimate. Use the sum of the Backlog Item Estimate value when querying data for the simulation input With this option, Backlog Items that do not have an Estimate are not considered. - Workitem Count. Use a count of Backlog Items when querying data for the simulation input. With this option Backlog Items that do not have an Estimate are considered. | Total Estimate |
Additional Options
- Printing a report
- Saving a report to PDF
- Working with Analytics Dashboards