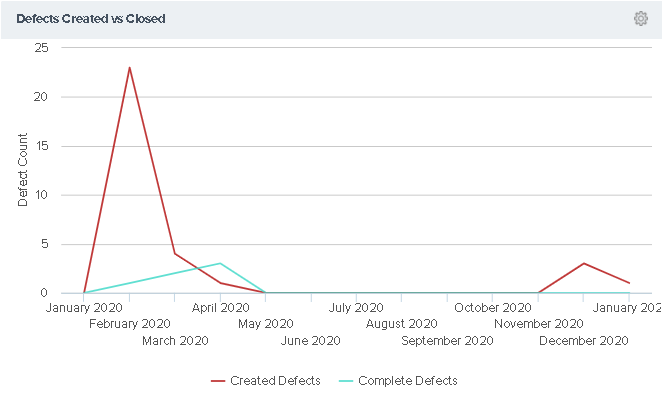
Defects Created vs Closed Dashboard Panel
This article provides an overview on the Defects Created vs Closed Dashboard Panel in Agility.
The Analytics Defects Created vs Closed dashboard panel trends the how Defects were created and closed on a given period of time.

Accessing this Panel
- Click the hamburger menu
> Analytics.
- Click on the Enterprise tab.
- If the panel is not visible, click the Add Panel button.
- In the Add Panels window, click the Add button for the panel and click Done. The panel should display on the dashboard.
- To configure the panel, click on the gear icon
at the top-right corner and click Edit.
Measures
This chart contain 2 lines. One indicating how many Defects were created in the month, or quarter, indicated on the X-Axis and another indicating how many Defects were closed in that same period.
Configuring the Panel
- To configure the panel, click on the gear icon
at the top-right corner and click Edit.
- Choose from the panel parameters below.
Parameters for this panel may differ depending on the location of the dashboard.
Panel Parameter Descriptions
- Interval: The period (monthly or quarterly) for grouping the throughput data used for the calculation.
- Number of Years to Look at Data: The number of years back to consider. The default is 1 year.