View Tasks on the Taskboard
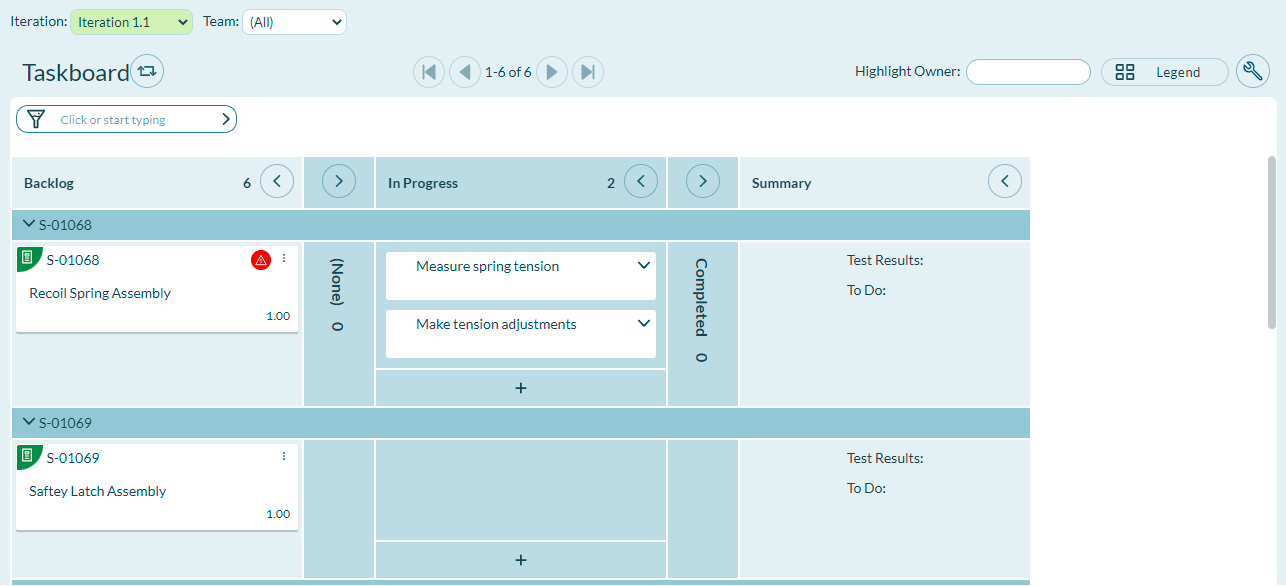
The Taskboard page is a consolidated view of tasks grouped by defect and task status. From this page, you can track, update, and report on backlog items, defects, and tasks for projects, sprints, and teams.
To access the Taskboard, click the hamburger menu ![]() > Sprint > Task Board.
> Sprint > Task Board.
Track and Update Tasks
On the Taskboard, Task Cards display in status columns (for example, Future, Design, In Progress, Completed) and show the task title, owner, and total work estimate. Task cards are color-coded by type (such as Design, Code, Administration) to give you a high-level view of the balance of work across project work functions. Click the Legend button at top right of the board to see the color representation or to customize the color-coding scheme by task type.
Steps
-
Click the hamburger menu
 > Sprint > Taskboard.
 -
Select your context:
- Select the project for which you want to review team summaries from the project tree at the top of the page.
- Select the sprint you want to track from the Sprint drop-down list.
- Select the team you want to track from the Team drop-down list.
-
Open the Filter drop-down menu and select a filtering option to focus on a subset of backlog items (i.e., view by Backlog Group, Portfolio Items, Owner, Status, Priority, Backlog Item, Defect, or closed items). To focus only on tasks assigned to an individual owner, select the owner name in the Highlight Owner field at the top of the board. This action fades out all tasks not assigned to the highlighted owner so you can see where that task owner fits into the overall project or sprint picture (as opposed to selecting Owner from the Filter drop-down, which isolates the view to show only that owner's tasks, removing all others from the board).
-
Hover over any Task Card title to see a detailed description of the task. To update a task, click the vertical ellipsis
 icon at the top-right corner of the card and select the appropriate action. To indicate a change of task status, click and drag the Task Card to the appropriate status column in that row.
 -
As work progresses, enter Effort and update the remaining To Do estimate for each task by clicking the vertical ellipsis
icon followed by the Edit option on the Task card.
Viewing and Filtering Tips
- Use the Highlight Owner option to highlight the work assigned to a single team member so that each individual can more easily recall what work they have done and what is next up on their list. Highlighting (Nobody) allows team members who are ready to sign up for new tasks to easily see unassigned tasks that are available.
- If any of the tasks are owned by the Owner, you see all the tasks associated with the parent backlog item. This is to ensure that you get the larger context. We feel it is important for you to see not only the individual task owned by the filtered owner, but all the tasks in that associated story so you are aware of the overall developments with that backlog item.
- Pop up the Standup Dashboard page in a new window and expand the page to view the Taskboard and graphs without the surrounding page wrapping so that you can view more on the page.
Customize Taskboard
In order to customize the Taskboard, your project role must be "Project Lead" or above.
Customize Columns
The Status attribute defines the columns in the board display. Add new columns by adding a new List Value to the Status list type and enabling that value for use in a project using the Project Workspace settings on the Display Fields page in Administration.
Customize Task Card Colors
Click the Legend button to review current color representation settings or to configure the color coding by task type. Backlog cards retain any customizations made via the Storyboard of the same project so that any changes there are available on the Taskboard as well.
The board view includes items on subprojects even if those items fall outside of the list values designated for the columns, rows, or coloring scheme defined for the board. For example, if the board is colored by Type and a subproject of the current project selection uses a particular Type value that is not used on the selected project, that lower level Type value still receives a color on the board.
Taskboard Reports
Two inline reports allow you to review statistics for the current view of your Taskboard:
- Standup Dashboard Report
- Burndown Report
Access Reports
- Click the hamburger menu > Sprint > Taskboard.
- While on the Taskboard page, click the Reports icon
 on the side bar to access these reports.
 - For the Burndown report, filter the data to be included in the report from the drop-down lists (Sprint, Team, Backlog Group, Workitem, Start Date, Duration, and whether you want to include all projects) and click Go. The bar graph populates with the appropriate detail. For the Standup Dashboard report, click Configure to change the start and end date of the report.
- Click Print to print a paper copy, or click PDF to generate an electronic copy. You can also click the Chart Context Menu
 in the upper right corner under the action buttons to save the report as a PNG graphic, download it as a CSV file, or download it as an XLS spreadsheet.
Related concepts
Using Tasks to Breakdown Stories Backlog Items
Related references
Admin Privileges Role Summary and Descriptions