Project or Program Summary Report
The Project or Program Summary report is an executive-level summary of a project. This report is a combination of two views:
-
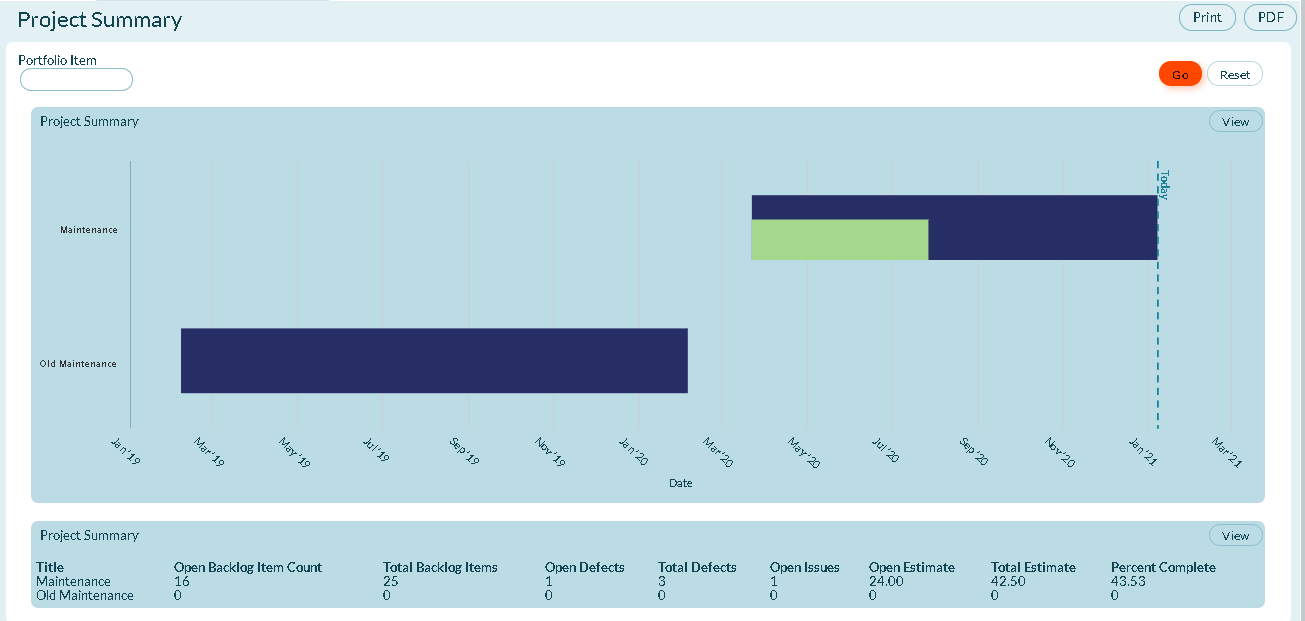
The first view is a distribution table that shows a rollup of the key workitems and progress against the estimates for the selected level and each of its components. Use this summary table to understand the progress the team has made to date.
-
The second view shows a time line of the project in Gantt chart format, which compares the percentage completion of the team's progress versus it's remaining time. You can use this to get a high-level picture of plans and progress across the selected context.
-
-
The bar for each project shows the total length of the project.
-
The progress indicator within each bar shows the percentage of completed features.
-
There is also a time indicator that shows the current day within the time line.
-
-
Prerequisites
To view this report, Effort Tracking must be enabled.
Viewing the Project or Program Summary Report
-
Click the hamburger menu
 > Reports > All Reports.
 -
In the Executive Reports section, click Project or Program Summary.
-
Enter a Portfolio Item (optional) to filter the report and click Go.
-
- To clear filters, click Reset.
Report Filters or Parameters
Portfolio Item: Shows work items in the selected portfolio item and all of it's children. The default option is "Blank" and shows all work items.
If you select the Program filter at the project level, this report shows a summary and timeline for the list of projects contained in the program. It will include a total row for the portion of the program that falls within the project. Note that the Schedule and Single Level Project Views project filters do not impact the report output.
Additional Options
- Printing a report
- Saving a report to PDF
Related concepts
Related tasks
Applying Filters to the Project Timeline
Publishing and Sharing a Project Timeline
Setting Project Start and End Dates on a Project Timeline