Portfolio Item Bubble Chart Report
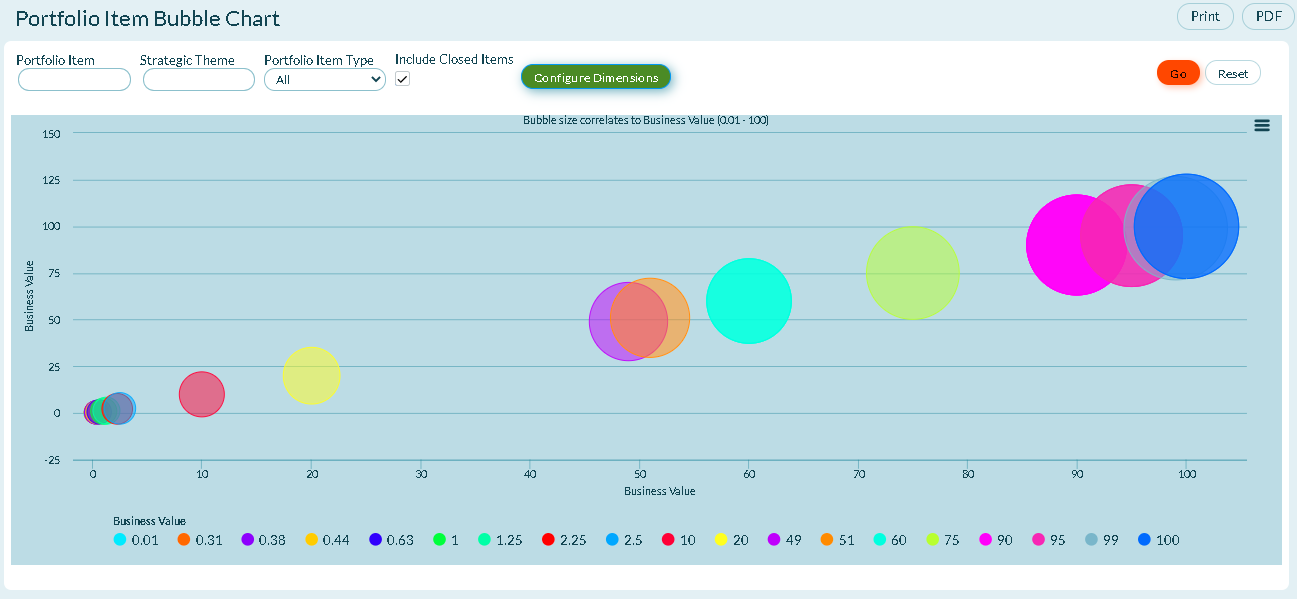
The Portfolio Item Bubble Chart separates portfolio items by cost, value, risk, and assessed priority. It can be focused on any portfolio item type within the selected project so you can compare top-level business initiatives or lower-level features.
Use this chart to identify the portfolio items (or development efforts) that provide the most value to the business.
Accessing this Report
-
You can access this report in two ways:
-
- Click the hamburger menu
 > Reports > All Reports. In the Executive Reports section, click Portfolio Item Bubble Chart, or
 - Click the hamburger menu > Portfolio > Portfolio Kanban. Click the Reports icon
 on the side bar and click Portfolio Item Bubble Chart in the On This Page section.
- Click the hamburger menu
-
Enter the report filter criteria in the appropriate fields.
-
- If you want to customize the X and Y axis, Color, or Size, click Configure Dimensions and enter your dimensions.
-
Click Go.
Report Filters or Parameters
- Portfolio Item: Shows work items in the selected portfolio item and all of it's children. The default option is "Blank" and shows all work items.
- Strategic Theme: Allows you to narrow the report to focus on the items that support a given strategic theme.
- Portfolio Item Type: Shows data for the selected Portfolio Item Type (Initiative, Feature, etc.) within the current project.
Technical Details
- The size of the bubbles are proportional to the portfolio item's Swag. portfolio items with no Swag are shown as fixed size squares.
- The bubble colors represent your organizations customized priority colors, including custom fields, list types, dates, and numbers.
- Note that filter options persist throughout the application and are specific to each user.
Additional Options
- Printing a report
- Saving a report to PDF
- Exporting or Saving a report to Microsoft Excel, CSV, or PNG