Customize PlanningRoom Panels
PlanningRoom panels visualize and track planning data through customizable views. Each panel provides a different perspective on your work, from backlogs and scorecards to storyboards and dependency boards.
Permission requirement: All PlanningRoom members can display and hide panels. Installing and configuring panels requires Project Admin permissions.
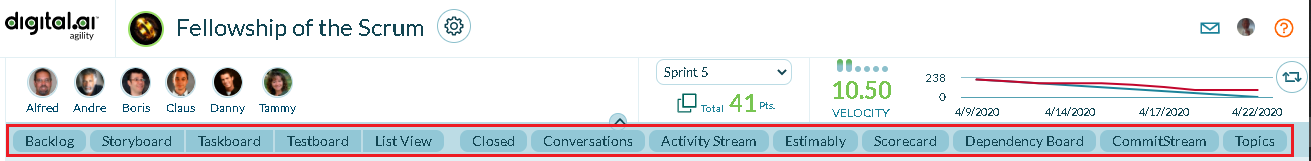
Each PlanningRoom displays a set of tabs just below the member avatars. These are toggle tabs that can be turned on or off to display panels that show different types and levels of detail about your planning work. The Scorecard panel provides detailed metrics to help you understand progress and performance.
Display or Hide PlanningRoom Panels
Access and toggle between different panels to view the information you need.
- Click the hamburger menu
 > Rooms > All TeamRooms.
 - Click on a panel tab to display any of the following panels in your TeamRoom.
- For instance, click Backlog to open the Backlog panel for a TeamRoom.
Available panels
| Panel | Description |
|---|---|
| Backlog | - See a rough view of how your unscheduled backlog might fall into sprints by grouping backlog items into sprint-sized segments based on their estimates and the current average velocity. - View unscheduled backlog from your TeamRoom''s context. - Items display in rank order, with the highest ranking at the top. - The item''s estimate is also shown if an estimate value exists. - For Kanban TeamRooms, the items are grouped by week, based on the team throughput. - Drag and drop backlog items between columns to update the status. |
| Backlog Goals | Shows measurable backlog goals along with metrics such as Estimate points, % of completion, and Progress. |
| Issues | Shows list of assets that capture roadblocks or dependencies along with details such as Priority, Target Date, and Owner. |
| Retrospectives | Shows information about the team''s iteration or release. This panel also allows you to add and conduct Retrospectives. |
| Close Sprint/Iteration | Close or move Workitems at the end of a Sprint. |
| Storyboard | Shows all the stories (displayed as story cards) in a sprint or iteration in the selected sprint. |
| Taskboard | Shows tasks grouped by backlog item or defect and by task status in the selected sprint. |
| Testboard | Shows acceptance tests grouped by backlog item and/or defect and by test status in the selected sprint. |
| List View | This panel shows a list of work items in the selected sprint. |
| Closed | - Allows you to review closed work. - Items are grouped by their sprint and sorted by sprint start date. - Item estimates display, when assigned to the item, and estimate totals display on the sprint. |
| Conversations | Shows all conversations started in the room as well as conversations that mention work items in the room. |
| Activity Stream | - Shows all the activity that has occurred on the assets in the TeamRoom. - Items display in reverse-chronological order and only display once in the list based on the most recent change. |
| Estimably | - Allows the creation of an Estimably estimation game. - After starting a game, drag items from the Backlog panel into this panel to estimate them. Note that when you submit the results of a game, the estimate for that item is also updated. |
| Scorecard | Instant access to a barometer of key project performance indicators at the project, program, portfolio item, and team level. |
| Dependency Board | Shows dependencies between planned, unplanned, and Out of scope Portfolio Items or Backlog items. |
| CommitStream | If enabled, the panel shows all the commit information for the repositories that have been configured in TeamRoom settings. |
| Topics | View Communities Topics directly within your TeamRoom. |
Use the PlanningRoom Scorecard
The PlanningRoom Scorecard shows metrics to help you understand the progress of work visible in a PlanningRoom. Use the Scorecard to:
- Compare actual and expected progress of the planned work
- Understand the remaining work and historical trends on work that has already been delivered
The metrics displayed on the PlanningRoom scorecard reflect data visible in the selected PlanningRoom.
###View the PlanningRoom Scorecard
- Click the hamburger icon > Rooms > .PlanningRooms
- Click on a room name
- Click the Scorecard tab
Understand the PlanningRoom Scorecard
The following sections of the PlanningRoom Scorecard shows metrics for the work assigned directly within a PlanningRoom.
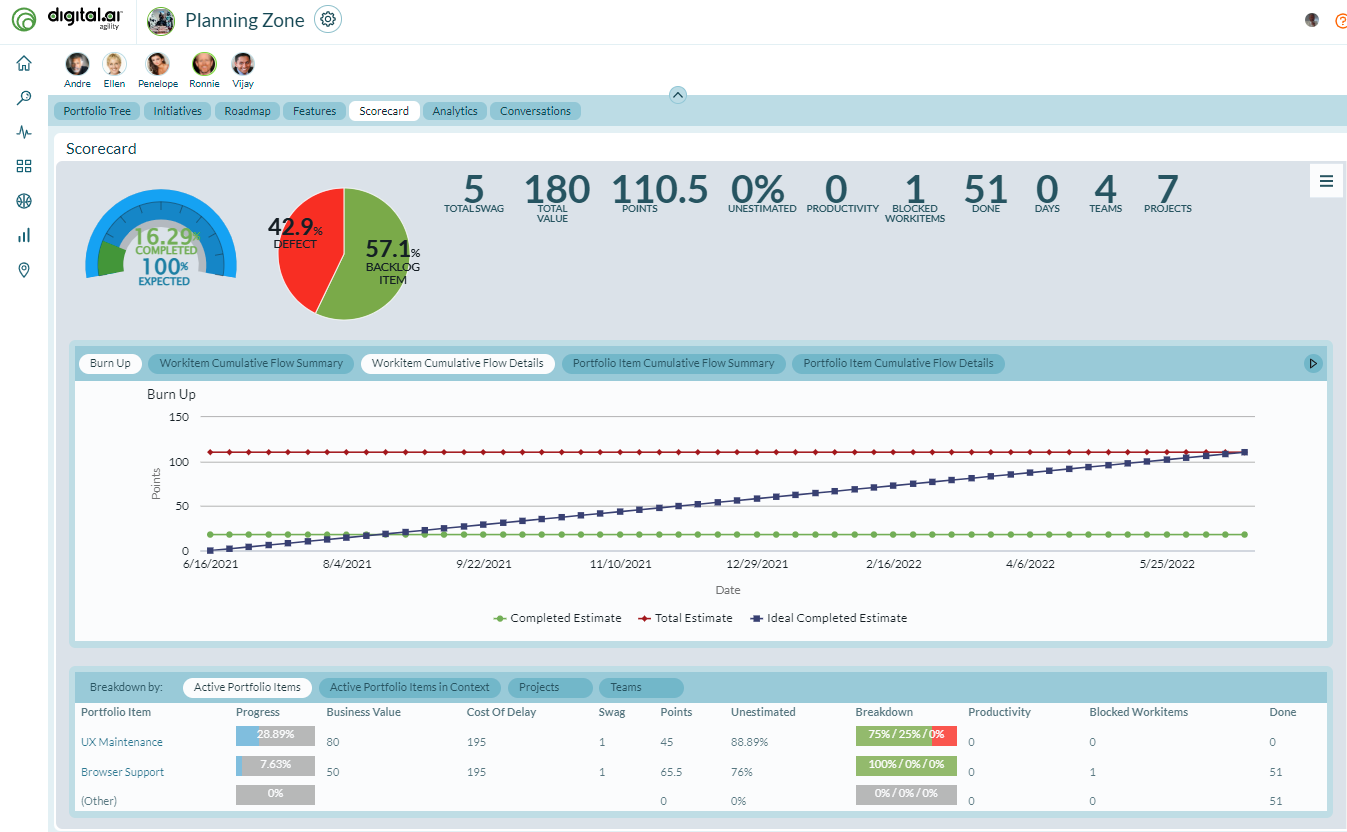
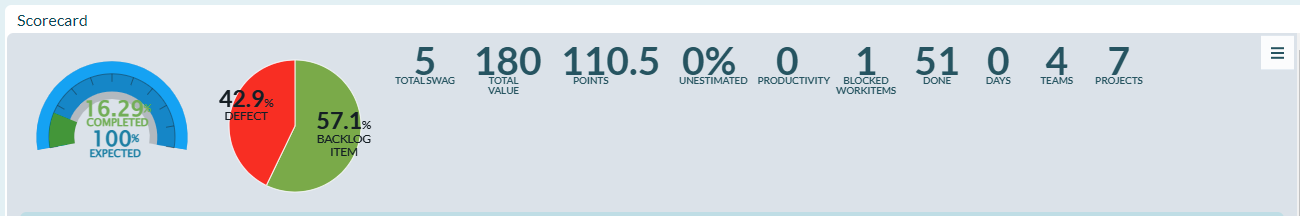
Summary section
The Summary section, located at the top of the page, shows metrics that roll-up all work contained in the project or program along with the Strategic Theme filter.
-
Progress Gauge. Compares the current percent complete by count, against the expected percent compete based on the defined time range. For a project, the start and end dates are taken directly from the project asset. For a program, the start date is the earliest start date for all projects in the program and the end date is the last end date for all projects in the program. If there is no end date on the project or any project in a program, no expected percent complete value displays.
-
Work Breakdown Pie Chart. Indicates the amount of remaining work in stories, defects, or test sets. This breakdown is based on count in order to capture all work regardless of estimate.
To calculate the percentage for particular type, divide the number of that type by the total number of all three. To calculate this value, you need to first navigate the a level in your project tree high enough to see all projects containing work for the portfolio item in question. Next, filter the backlog grid to the item in question and note the number of items returned in the grid paging control (1-25 of ????). Then, filter the grid to the specific work item type ( Backlog Item, Defect, TestSet) and note the number of items returned in the paging control. Now divide the second number by the first number and multiple the results by 100. Round this answer to 1 decimal place.
-
Total Swag. The roll-up of total Swag for all portfolio items. If there are any epics that do not have a Swag, you will see a question mark next to the Total Swag.
-
Total Value. The total Business value for all tracked portfolio items.
-
Points. A roll-up of the total estimate value for all stories, defects, or test sets regardless of whether the item is open or closed wherever they exist in the system. This value is available on the Portfolio Item Details page and on the Portfolio Tree grid. You can enable the value for cards on the Portfolio Kanban.
-
Unestimated. Percentage of active work that does not have an estimate value. This value is calculated by dividing the total number of active stories without an estimate by the total number of stories and multiplying the answer by 100. Round that answer to 2 decimal places.
-
Productivity. The average number of stories, defects, or test sets closed per week for the past 4 weeks. To calculate this number, determine how many items were closed per week for the last 4 weeks. You then find the average and round the value to 1 decimal place.
-
Blocked Workitems. The total number of active stories, defects, or test sets that are currently blocked. This value is available today on the Portfolio Tree by adding the "Blocking Issues - Rollup" column. You can also add this information to cards on the Portfolio Kanban.
-
Done. The total amount of effort that has been reported against work assigned. Ownership of the work item is considered when calculating this value nor is the value allocated to the current owners. Effort entered by people that do not own work assigned to the Team displays in the "None" row. This metric is hidden if Effort Tracking is disabled in your instance.
-
Days. The total number of days remaining before the delivery date.
-
Teams. The number of teams that own work.
-
Projects. Shows the number of active projects or child projects assigned to the program, project, or team.
Charts section
The charts section, located in the middle of the page, displays the Burn Up, Workitem Cumulative Flow Summary, Workitem Cumulative Flow Details, Portfolio Item Cumulative Flow Summary, and Portfolio Item Cumulative Flow Details allowing you to trend the work in the PlanningRoom.
Burn Up Chart
Indicates, by date, the total Estimate value and how much work has been delivered. There is also a linear projection line (an ideal line) from 0 to the total estimate value in the defined time range.
The end date for this chart is the Project end date or the latest end date on a Program. If there is no end date, the current date is used.
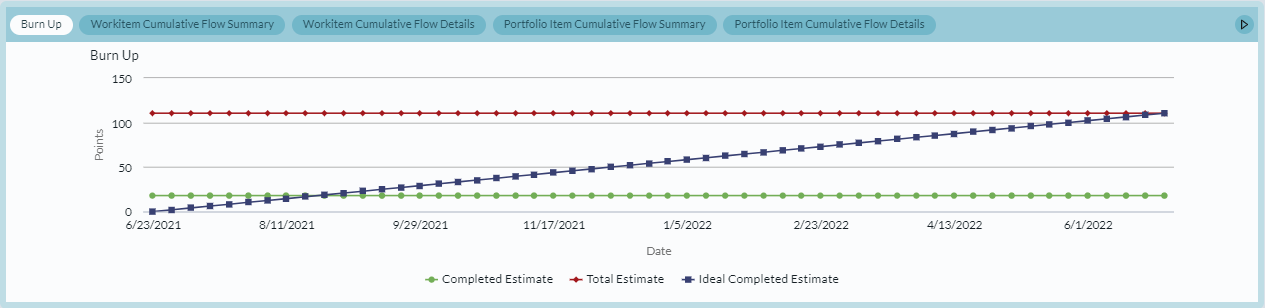
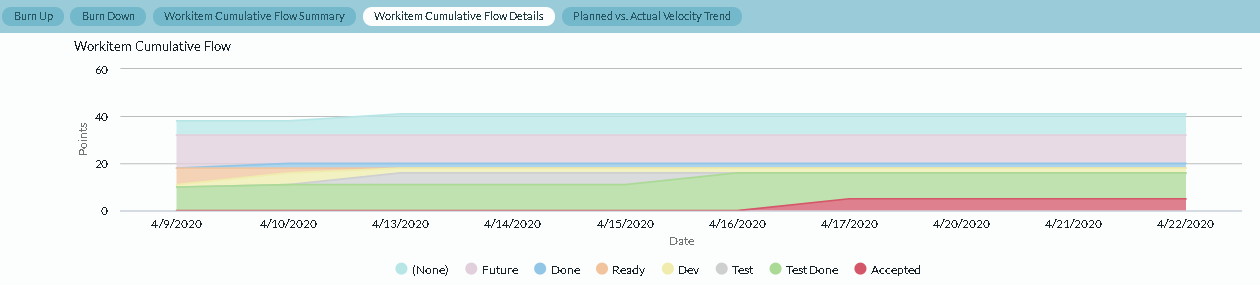
Workitem Cumulative Flow Summary
Indicates, by date, the total number of Stories, Defect, and TestSets by status. This chart does not consider any work items closed before the Start Date. The End Date is always the current date.

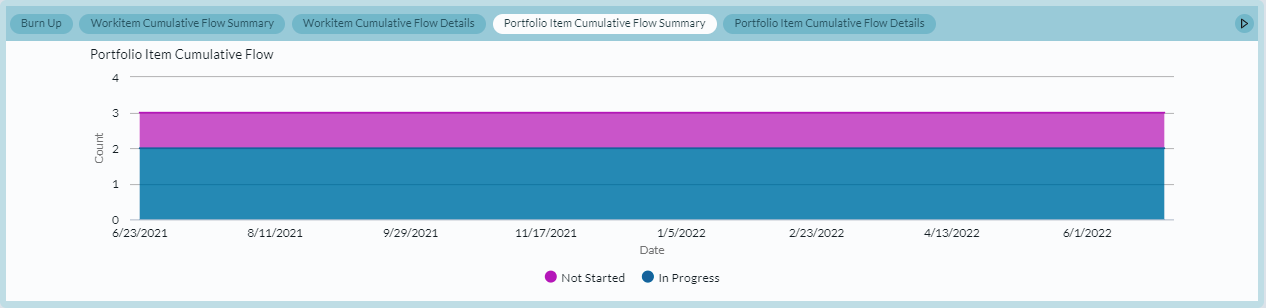
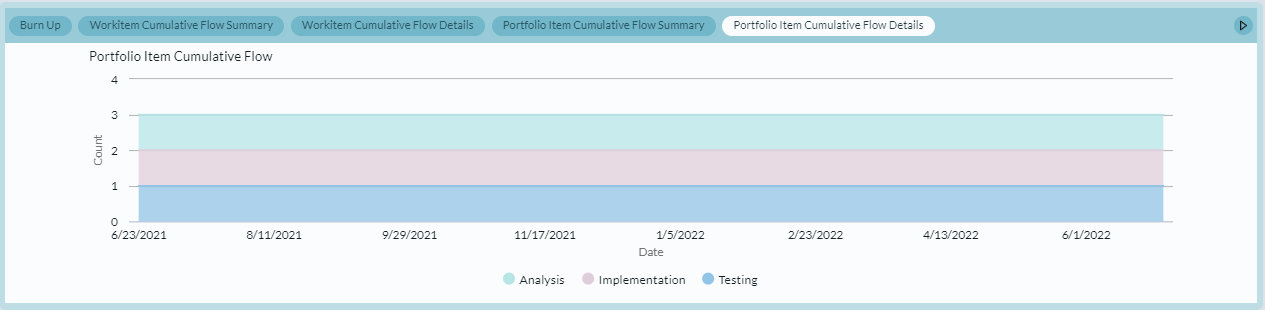
Portfolio Item Cumulative Flow Summary
The Portfolio Item Cumulative Flow report shows the progress of portfolio items across Portfolio Kanban boards for a specific period of time. Portfolio item progress is broken down by status and creates a "burnup" chart as they move through the process.
Breakdown section
The breakdown section allows you to decompose work by specific dimensions such as Active Portfolio Item, Project, or Team.
Clicking on a title will take you to a type specific scorecard for the selected item.
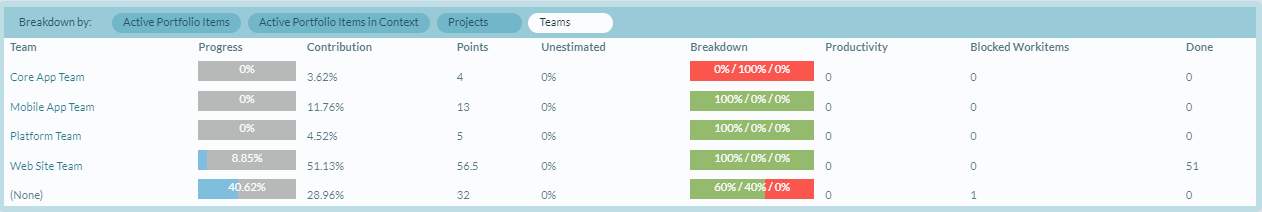
Breakdown by Teams
The Team Breakdown section provides insight into the performance of each Team responsible for delivering work in this PlanningRoom. Each row represents a single Digital.ai Agility Team that owns the active work. Additionally, there is also a row to account for work not assigned to a team.
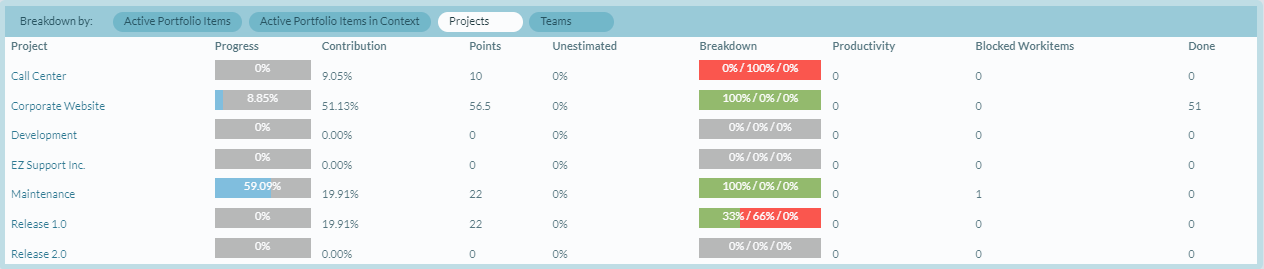
Breakdown by Projects
The Project Breakdown section provides insight into how work in the selected PlanningRoom is distributed across selected Projects for this PlanningRoom Each row represents a single Project that contains work assigned to this sprint in the PlanningRoom. There is no Project roll-up; if a parent and child project both contain work, both are listed.
Breakdown by Active Portfolio Items
The Active Portfolio Item Breakdown section provides insight into how work in the PlanningRoom context aligns to parent Portfolio Items that are in the "Active" roll-up category. Metrics in this breakdown are rolled-up; each value represents all work below the child, including work in subsequent children.
Breakdown by Active Portfolio Items in Context
The Active Portfolio Item Breakdown in Context section provides information about context in addition to the information displayed in the Breakdown by Active Portfolio Items section. The Contribution column in this section indicates how much work these Portfolio Items contribute to the Strategic Theme.
Breakdown options
-
Title. The project, program, portfolio item, or team name
-
Progress. Actual percent of completed work. This value is based on count to account for unestimated items.
- Actual percent complete is determined by dividing the number of closed work items by the total number of work items multiplied by 100.
- The expected percent complete is date based. Therefore it is only displays when an end date is specified. To calculate this value, we divide the number of workdays remaining by the total working days and multiple the result by 100. In this context, a working day is any weekday between the start and end date.
-
Contribution. The percentage contribution of a portfolio item''s estimate to the total estimate.
-
Business Value. The total Business value for all tracked portfolio items.
-
Cost of Delay. This is calculated as a sum of Business Value, Time Criticality, and Risk Reduction. It is used to decide which features to prioritize.
-
Swag. The roll-up of total Swag for all portfolio items.
-
Points. A roll-up of the total estimate value for all stories, defects, or test sets regardless of whether the item is open or closed wherever they exist in the system. This value is available on the Portfolio Item Details page and on the Portfolio Tree grid. You can enable the value for cards on the Portfolio Kanban.
-
Unestimated. Percentage of active work that does not have an estimate value. This value is calculated by dividing the total number of active stories without an estimate by the total number of stories and multiplying the answer by 100. Round that answer to 2 decimal places.
-
Breakdown. Indicates how the remaining active work is broken down by type (stories, defects, or test sets). This value is always based on count in order account for unestimated items.
-
Productivity. The average number of stories, defects, or test sets closed per week for the past 4 weeks. To calculate this number, determine how many items were closed per week for the last 4 weeks. You then find the average and round the value to 1 decimal place.
-
Blocked Workitems. The total number of active stories, defects, or test sets that are currently blocked. This value is available today on the Portfolio Tree by adding the "Blocking Issues - Rollup" column. You can also add this information to cards on the Portfolio Kanban.
-
Done. The total amount of effort that has been reported against work assigned. Ownership of the work item is considered when calculating this value nor is the value allocated to the current owners. Effort entered by people that do not own work assigned to the Team displays in the "None" row. This metric is hidden if Effort Tracking is disabled in your instance.
Best Practices
Install only panels you use regularly: Minimize panel clutter by displaying only the panels your team actively uses for planning activities.
Bookmark Scorecard views: Save direct URLs to Scorecard panels for rooms you monitor frequently to track progress efficiently.
Review Summary section first: Check the Progress Gauge and Work Breakdown Pie Chart to quickly assess overall health before diving into details.
Monitor Unestimated percentage: Keep this value low to maintain accurate planning forecasts and progress tracking.
Track Blocked Workitems regularly: Review blocked items frequently to identify and resolve impediments before they affect delivery.
Use Burn Up Chart for trend analysis: Compare actual progress against the ideal line to identify delivery velocity trends and potential risks.
Leverage Breakdown sections for accountability: Use Team, Project, and Portfolio Item breakdowns to understand contribution and identify areas needing attention.
Configure panel visibility per room purpose: Different planning groups need different panels (portfolio rooms need Portfolio Kanban, team rooms need Taskboard).
Check Productivity metrics weekly: Monitor the 4-week average to understand team throughput and identify significant changes.
Use Cumulative Flow charts for bottlenecks: Watch for widening bands in status categories to spot process constraints.
Troubleshooting
Why don't I see certain panels in my PlanningRoom? Panels must be installed by a Project Admin. Navigate to PlanningRoom Properties > Panels to see which panels are installed. Contact your admin to install additional panels.
Why is my Scorecard showing no data? The Scorecard displays metrics for work visible in the PlanningRoom. Verify the room's filters and project context are configured correctly, and ensure work items are assigned to the room's scope.
Why can't I configure a panel? Configuring panels requires Project Admin permissions. If you need to change panel settings, contact your Project Admin.
Related Topics
- Get Started with PlanningRooms - Access and navigate PlanningRooms
- PlanningRooms - Understand PlanningRoom capabilities
- Manage PlanningRoom Members and Panels - Customize room configuration
- Create and Configure PlanningRooms - Set up new planning workspaces
- Portfolio Kanban Board - Use portfolio Kanban panel
- Team Scorecard - Track team performance metrics