Simulating Different Network Conditions
Understanding how your application behaves under various network conditions helps improve user experience and optimize data usage. In manual testing, you can monitor network traffic and simulate different conditions.
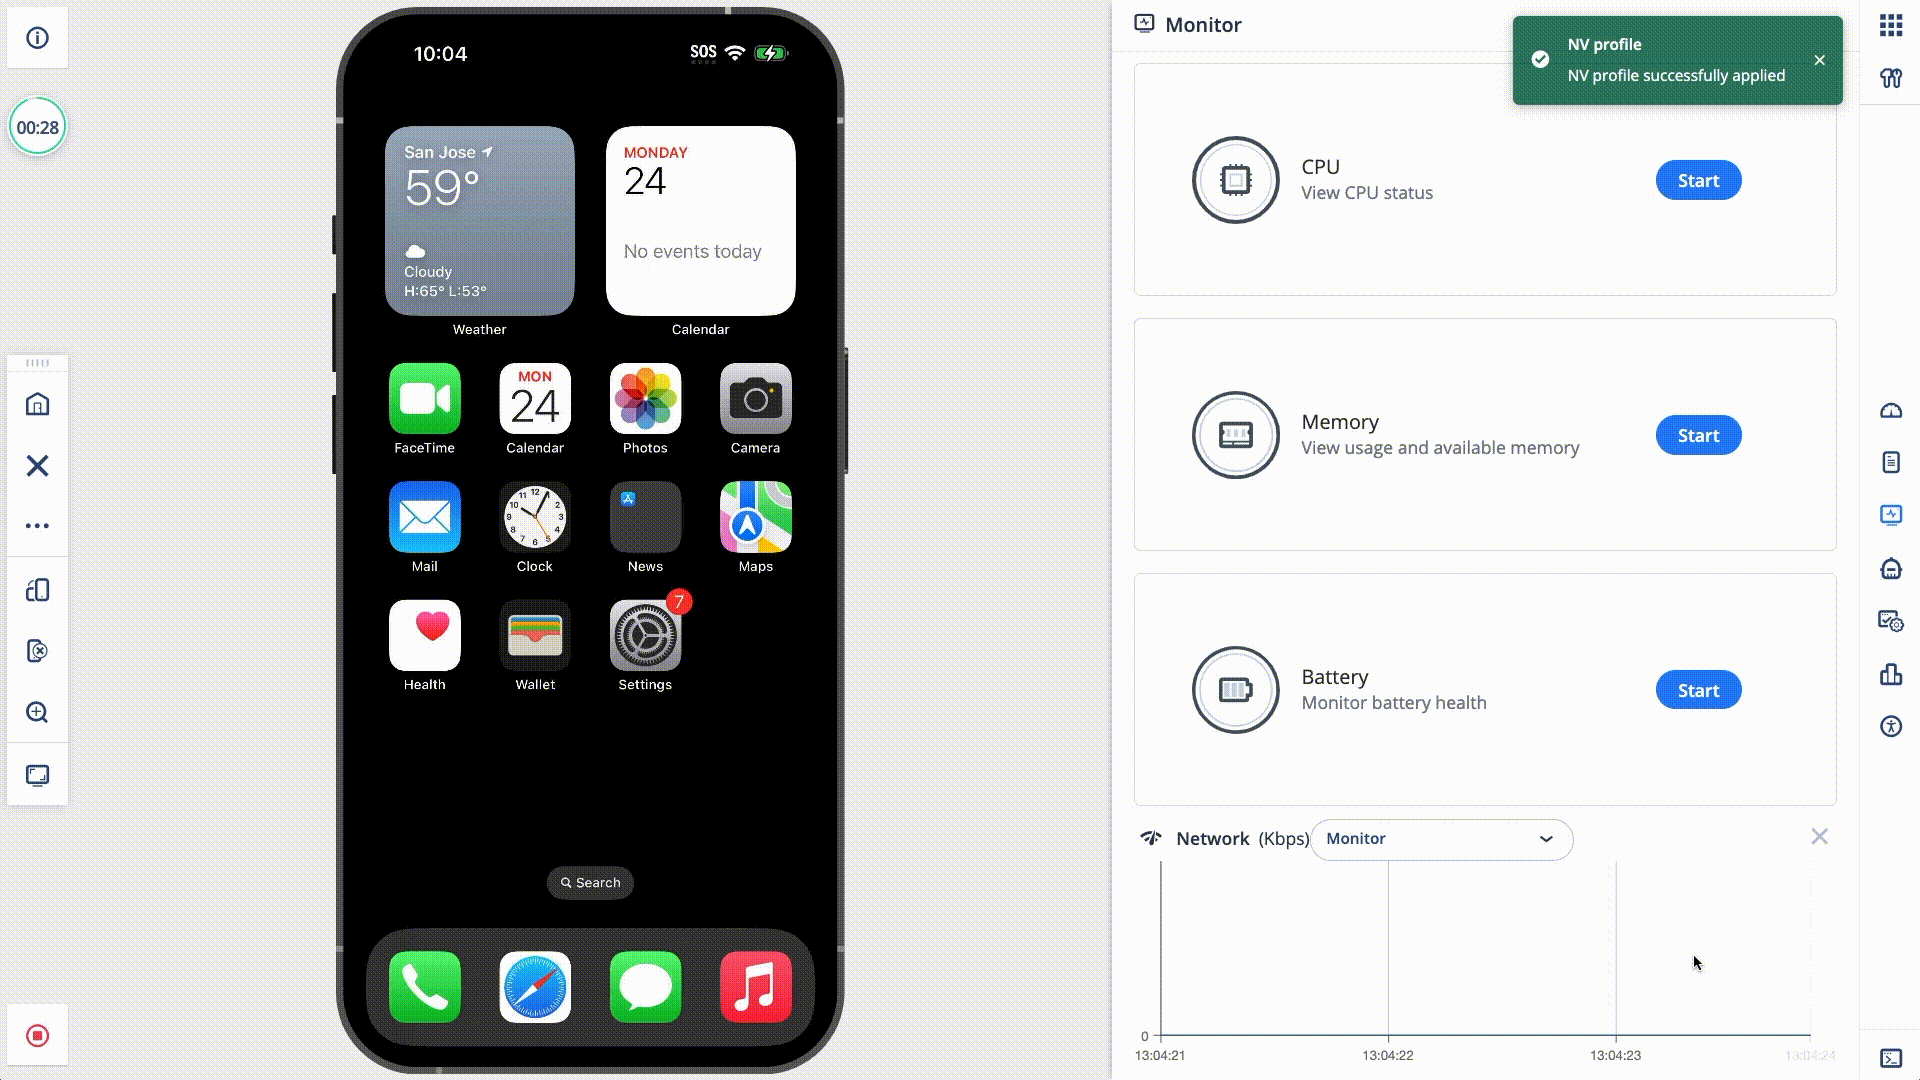
Getting to the Network Console
Start by opening a Mobile Device within a Mobile Studio session. For instructions, refer to the Getting Started with Mobile Devices section.
Next, click the Monitoring tab and press Start in the Network section.
The console displays two graphs:
-
Blue Graph: This represents downloaded data, such as webpage resources (HTML, CSS, images, etc.). For example, when a user opens your homepage, this indicator shows how much data is downloaded to render the page.
-
Red Graph: This represents uploaded data, such as when a user uploads a profile picture. It indicates the volume of data sent from the device during such actions.
By monitoring these graphs, you can identify areas where data usage might be optimized—minimizing downloads to reduce load times or managing heavy uploads to avoid performance issues.
Changing Network Profiles
To change the active Network Profile, click the dropdown and choose the profile that fits your testing scenario. Digital.ai provides default profiles labeled as 3G-[profile] and 4G-[profile].
You can create custom Network Profiles to mimic specific network conditions that suit your needs. See Create a new Network Profile for details.
You can also automate network condition simulations using Appium.