Monitoring
The Monitoring tool allows you to observe a Mobile Web or Native Application’s performance by analyzing the CPU, Memory and Battery consumption, and simulate a different network condition to understand the usability of your Application under various conditions.
Getting to the Monitoring Tools
To begin monitoring a device’s vitals, open a Mobile Device in a Mobile Studio session. For guidance, refer to the Getting Started with Mobile Devices section.
Within the Mobile Studio session, click on the Monitor tab.
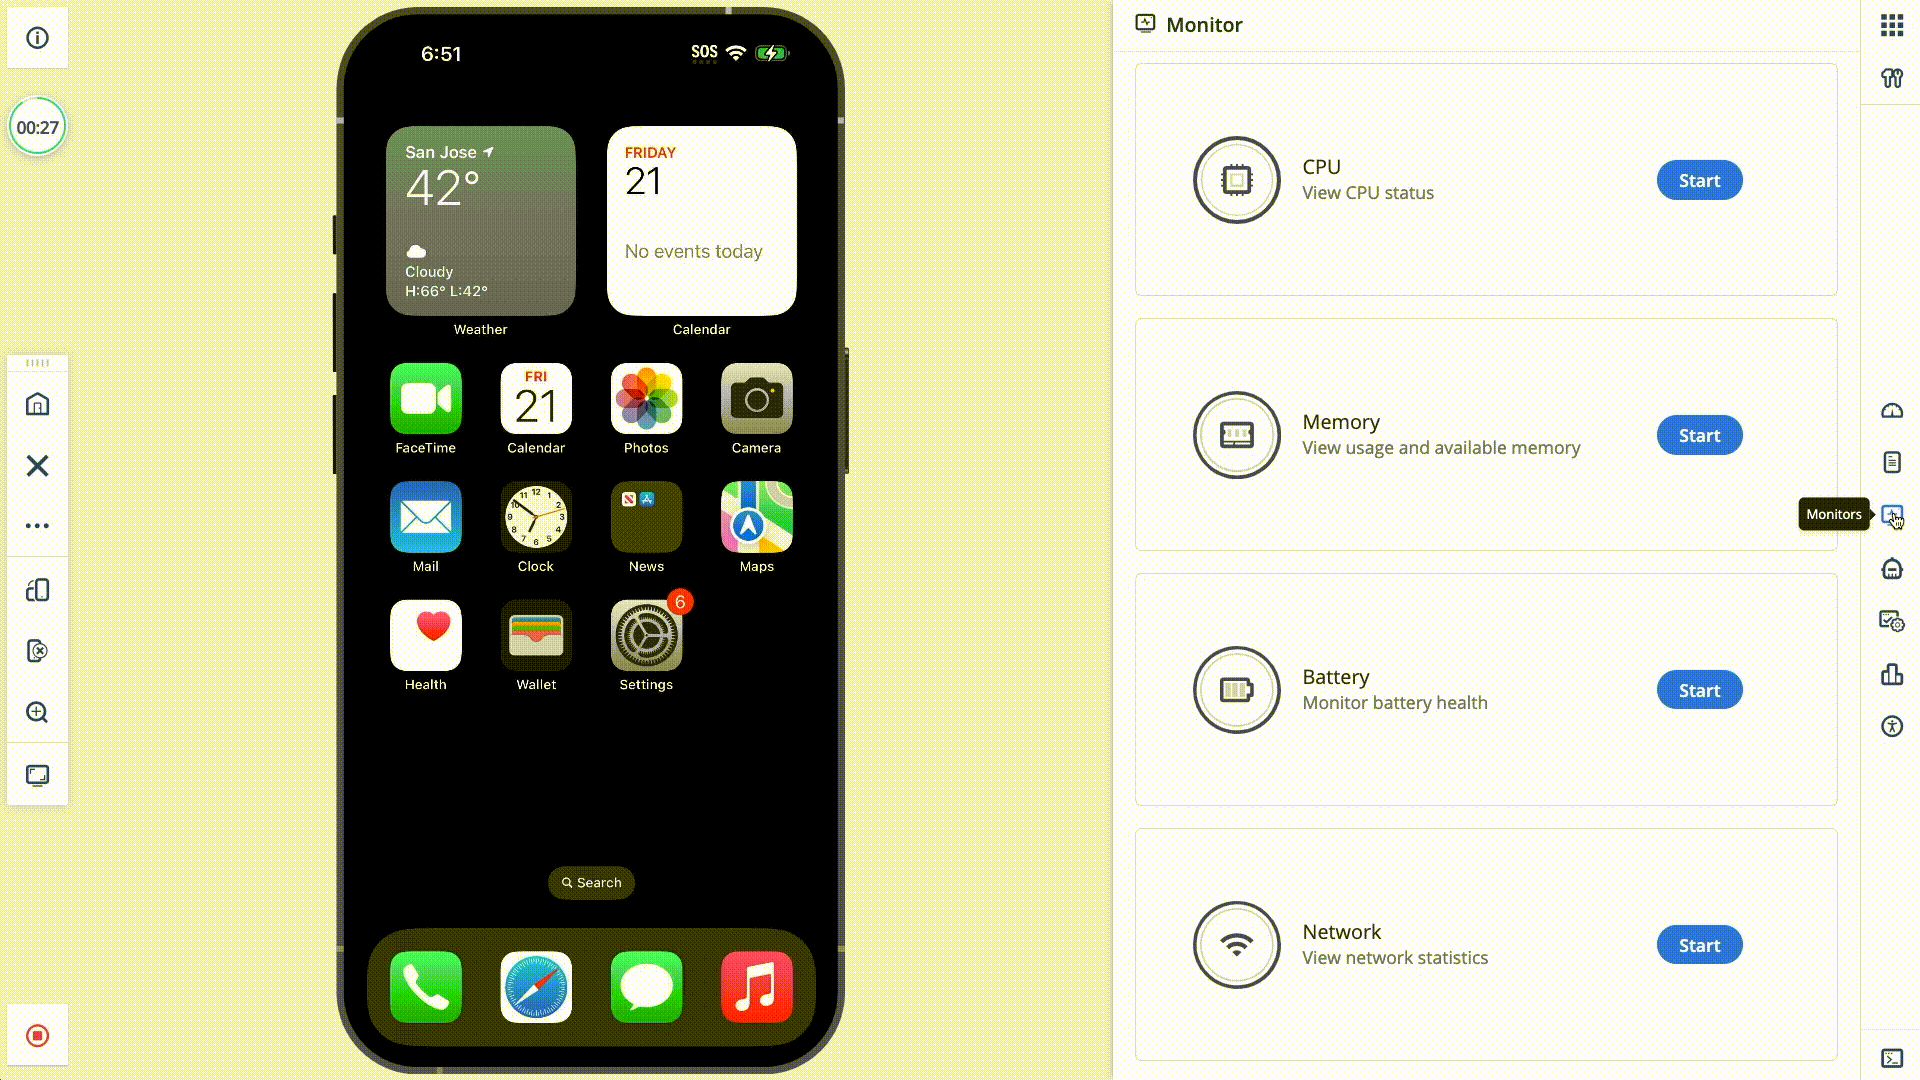
Metrics Overview
The Monitor tab provides real-time charts for the following performance metrics:
- CPU – Represented in %, based on the number of cores available on the device.
- Memory – Represented in MB, based on the total memory of the device.
- Battery – Represented in mV, based on the device’s battery capacity.
- Network – Simulate Different Network Conditions to mimic real-world scenarios.
These charts periodically sample data from the mobile device, helping you analyze performance trends in real time. By default, each chart shows system-wide data. To view specific processes, click on a chart and select or deselect the desired processes.
Generate Performance Reports - The Monitoring Tool helps you track real-time vitals while interacting with a device. To generate reports and automate performance analysis, check out Record Performance Transactions.