My Dashboard
The My Dashboard page provides a personalized view where you can track progress and visualize key metrics across multiple projects. Create custom charts, monitor project health, and analyze trends to make informed decisions about your work.
All roles create personalized dashboards. Team Members track their sprint burndown, Scrum Masters monitor team velocity, Product Owners visualize release progress, and Portfolio Managers review cross-project metrics. Each dashboard is private and can include charts from any project you have access to.
Access My Dashboard
To access the My Dashboard page:
- Click the hamburger menu
 > Rooms > My Room > My Dashboard.
My Project Summary Section
The My Project Summary grid appears at the top of the page and displays metrics to evaluate project status. Use filters to reduce the number of projects shown (for example, view only projects owned by a specific member).
The default grid shows these metrics for each project:
- Project Title — Name of the project
- Owner — Project owner
- End Date — Scheduled end date
- Projected End Date — Calculated projected completion date
- Progress Bars — Visual representation of work completion (hover to see open and closed estimates)
- Open Stories Count — Count of incomplete backlog items
- Open Defect Count — Number of unresolved defects
- Open Issue Count — Number of unresolved issues
You can add or remove columns by customizing the grid view. For details, see Using Grids.
Charts Section
Add charts to the bottom of the My Dashboard page to track progress at project, sprint, and team levels. These charts help you visualize trends and monitor key performance indicators.
Available Charts
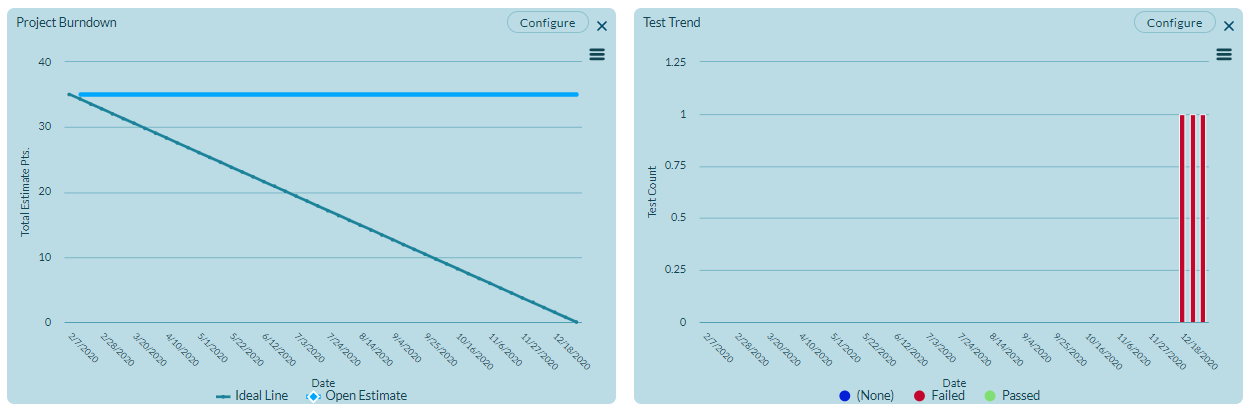
- Project Burndown — Track remaining work across the entire project or release
- Sprint Burndown — Monitor work completion within a sprint
- Workitem Trend — View trends in work item creation and completion over time
- Bug Priority Trend — Analyze bug distribution and trends by priority level
- Test Trend — Track test execution and results over time
- Velocity Trend — Measure team velocity trends across sprints
- Workitem Cycle Time — Monitor the time work items spend in various states
- Workitem Cumulative Flow — Visualize work item flow through different stages
Manage Charts
- Add a Chart to My Dashboard — Add new charts to visualize different metrics
- Configure a Chart — Customize chart data, filters, and display options
- Manage Dashboard Charts — Rename, reposition, enlarge, and remove charts
Track Release Progress
For guidance on tracking release progress using My Dashboard, see Track Release Progress.