Sprint or Iteration Burndown Report
This article explains hot to use the Sprint or Iteration Burndown report in Agility.
Overview
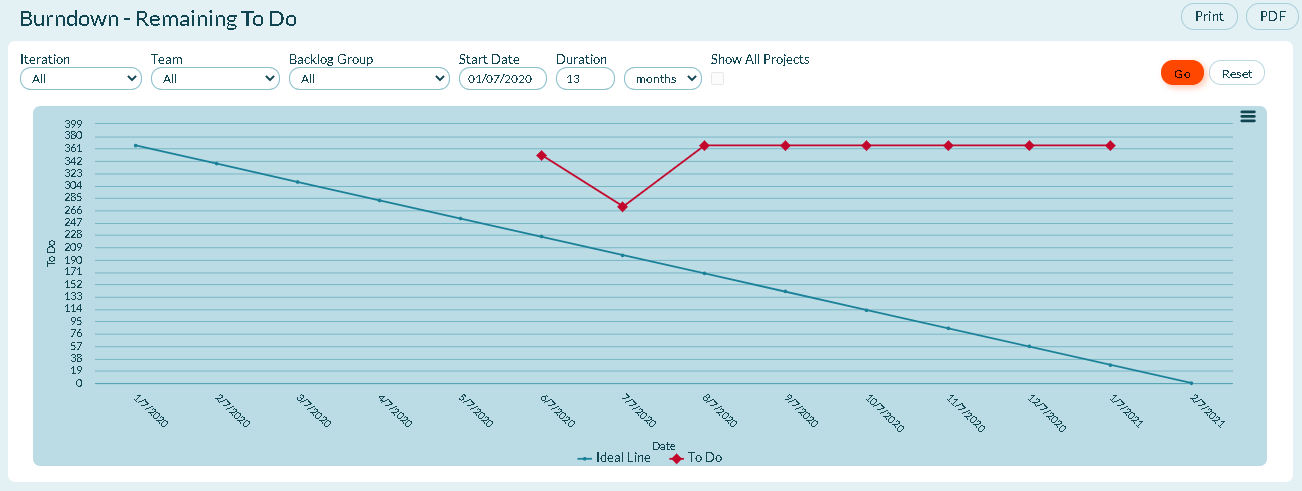
The Sprint Burndown (or Iteration Burndown) report shows the amount of remaining To Do in a sprint or iteration.
Use this report to see a team's progression through its workload.
Agile Insight
The remaining work appears to "burn down" as the team completes (or closes backlog items and defects) work during the selected time period. The team's goal is to complete all planned work by the end of the period so that the final snapshot shows nothing left to do. To learn more about this key agile concept, explore some of these links:
Accessing this Report
- Click the hamburger menu
 > Reports > All Reports.
 - Scroll to the Sprint or Iteration Reports section and click Sprint or Iteration Burndown.
Interpreting this Report
This report shows the following:
- To Do (Red line). Shows the total amount of remaining work during the selected time period. Each point on the line is the sum of the To Do remaining on that date.
- Ideal Line (Grey Line). Shows the amount of work that should be completed in an "ideal" scenario. The "burndown" slope shows the straight path (from the highest point on the first day of the period) and assumes equal progression every day thereafter.
Prerequisites
- All Digital.ai Agility trend reports require at least two data points. If not enough data is available, the report may be blank. Depending on the duration you select in the filters, at least one complete period of data must be available to draw a trend line. When selecting days, this means that the minimum duration is actually 2 days, which will include 2 data points.
- Your Show Weekend report settings may affect how much data is selected. For example, if you choose two days as duration and one day is a Saturday or Sunday, and you have elected to not Show Weekends, then you may not have sufficient data to show a trend.
Report Filters or Parameters
- Sprint or Iteration: Shows data assigned to the sprint or iteration. The default value is "All".
- Team: Shows Team-specific data for the project or program. The default value is "All" or "Blank".
Backlog Group:
Shows data assigned to the selected backlog group.
- Start Date: The first date the report begins calculating data.
- For project-based reports, the default start date is the project start date.
- For sprint or iteration-based reports, the default start date is the sprint or iteration start date.
- For member-based reports, the default start date is 13 weeks prior to the current date.
- If the start date is set to the current date or later, no data displays.
- Duration: The number of days, weeks, or months to display.
- For project-based reports, the default duration is the number of weeks from the project's start date to today.
- For sprint or iteration-based reports, the default duration is the number of days in the sprint or iteration.
- For member-based reports, the default duration is 13 weeks.
- The report ends at the current date, so if the selected start date and duration extend past the current date, no data displays after the current date.
Show All Projects:
Check this box to include all projects in your report.
Related concepts
Related tasks
Adding Chart to My Dashboard Page
Configuring Chart on My Dashboard Page