Team Estimate Trend Report
This article explains how to use the Team Estimate Trend report in Agility.
Overview
The Team Estimate Trend report shows changes in the total amount of Estimate assigned to a team, the amount completed, and the amount remaining during a specific period of time.
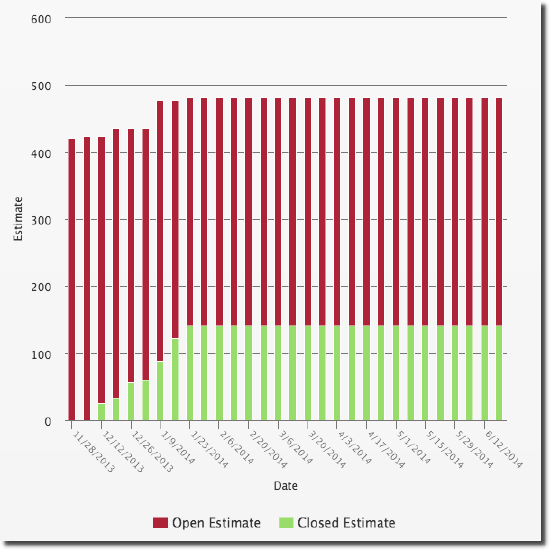
The total amount of closed estimate should trend upward over time. Changes to the total estimates typically occur because new items are added to the team's backlog, but may also be impacted by items being removed or because of changes in estimates on items already assigned to the team.
Accessing this Report
- Click the hamburger menu
 > Reports > All Reports.
 - In the Member or Team Reports section, click Team Estimate Trend.
Prerequisites
- All Digital.ai Agility trend reports require at least two data points. If not enough data is available, the report may be blank. Depending on the duration you select in the filters, at least one complete period of data must be available to draw a trend line. When selecting days, this means that the minimum duration is actually 2 days, which will include 2 data points.
- Your Show Weekend report settings may affect how much data is selected. For example, if you choose two days as duration and one day is a Saturday or Sunday, and you have elected to not Show Weekends, then you may not have sufficient data to show a trend.
Report Filters or Parameters
- Sprint or Iteration: Shows data assigned to the sprint or iteration. The default value is "All".
- Team: Shows Team-specific data for the project or program. The default value is "All" or "Blank".
- Backlog Group:
Shows data assigned to the selected backlog group.
-
Workitem: Shows data for a specific work item type: All (all workitems), Backlog Items, Defects, or Testsets. The default option is "All".
-
Portfolio Item: Shows work items in the selected portfolio item and all of it's children. The default option is "Blank" and shows all work items.
-
Start Date: The first date the report begins calculating data.
-
- For project-based reports, the default start date is the project start date.
- For sprint or iteration-based reports, the default start date is the sprint or iteration start date.
- For member-based reports, the default start date is 13 weeks prior to the current date.
- If the start date is set to the current date or later, no data displays.
-
Duration: The number of days, weeks, or months to display.
-
- For project-based reports, the default duration is the number of weeks from the project's start date to today.
- For sprint or iteration-based reports, the default duration is the number of days in the sprint or iteration.
- For member-based reports, the default duration is 13 weeks.
- The report ends at the current date, so if the selected start date and duration extend past the current date, no data displays after the current date.
Additional Options
- Printing a report
- Saving a report to PDF
- Exporting or Saving a report to Microsoft Excel, CSV, or PNG