Interpreting Budget Details and Indicators
This article explains how to interpret Budget details and Indicators in Agility.
Overview
This article explains how to view and interpret all of the visual indicators shown on the Budgets Details page so you can better understand and track development efforts against these targets.
Viewing Budget Details
- Click the hamburger icon
 > Portfolio>Budgets.
 - Click View for the budget you want to view.
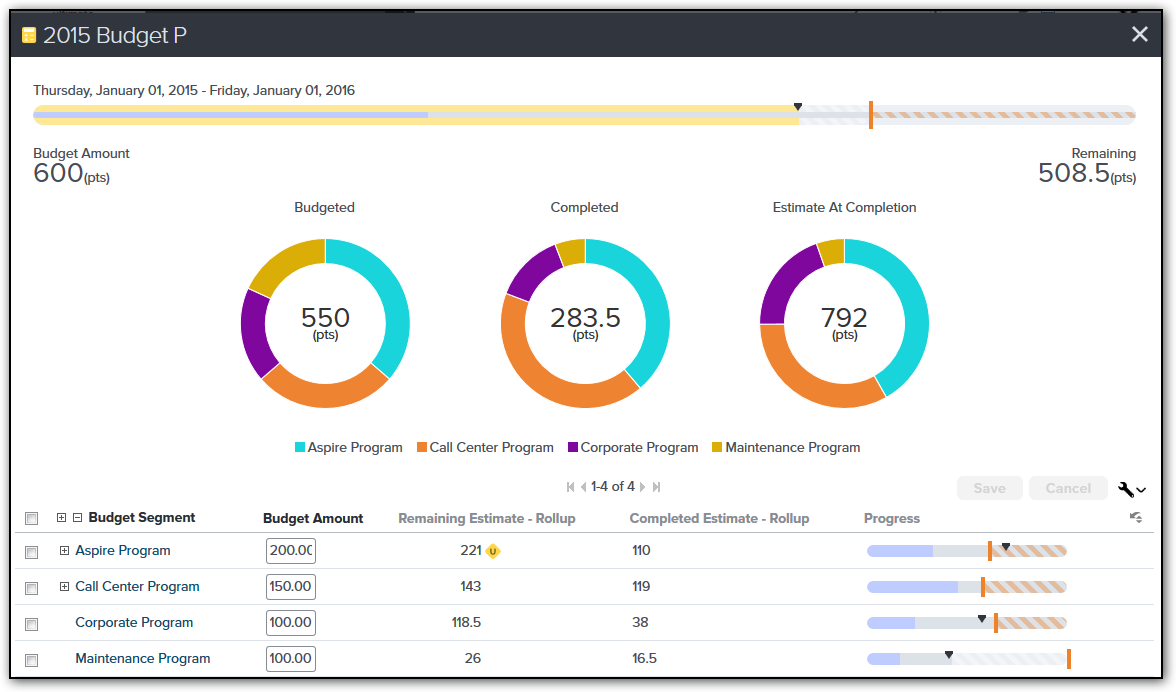
Understanding the Summary Bar
A summary bar displays at the very top of a budget. It's essentially a progress bar that you can use to gain an understanding of the overall budget, allocations, and the progress made till date. The following table describes all the colors and indicators in the Budget Details.
To see budget and progress details, hover over the summary bar or any chart.
| Color or Indicator... | Indicates... |
|---|---|
| Vertical Orange Bar | The amount of the budget. |
| Yellow Vertical | The total amount allocated to the budget segments. |
| Dark Blue | The amount of backlog-level work completed. |
| Lighter Blue | The amount of remaining planned work. |
| Black Triangle | The current date vs. the budget start or end. |
Segment Summary Donut Charts
Donut charts represent the relative allocation of the budget and workload across the budget segments.
| Chart Name | Indicates... |
|---|---|
| Budgeted | Displays the budget amounts by budget segment. If budget amounts are entered at multiple levels of a project tree, the total will include the uppermost amount entered in a given segment of the tree (i.e. it won't double count the budget amount if you make entries at multiple levels). |
| Completed | The relative amount of backlog estimate already completed within all covered budget segments |
| Estimate at Completion | The relative amount of total backlog estimate scheduled within the budget timeframe, both completed are remaining open. This is the amount that is currently planned to be completed at the end of the budget period. |
When budget values are entered at multiple levels of a project budget, the highest level budget entries are rolled up into the total. Entering allocations at multiple levels will not double count the values.
Row-Level Progress
For each strategic theme or project in the budget, the Budget Details page contains charts and progress bars to help you examine the amount of work actually completed and remaining.
Remaining Open Estimate is calculated as the sum of all scheduled estimate (work items scheduled into a project with an end date) that falls within the budget period. If a given project or release overlaps with the budget period, then the Open Estimate for the project or release is reduced to by the same ratio as the amount of the project's overlap.
An example:
Given the following Budget and Project timeline.

Only 50% of the project's Open Estimate rolls up into the budget because only half of the project falls within the budget's timeframe.
Hover your mouse over any part of a chart or bar to see detailed totals.
What do the colors, stripes, charts, and bars mean?
The table below explains the meaning of the bar colors and symbols that may display in the progress bars.
| Indicator Symbols |
|---|
| Vertical Orange Bar (Target Indicator) Shows the target budget capacity. |
| Budget Indicator Triangle Shows the percentage of budget time completed. The budget indicator starts moving from the left side of the bar at the beginning of the budget period and hits the right side at the end of the budget period. Use it to compare to the percentage of budget work completed. If all goes as planned, the progress of the blue bar stays with or ahead of the indicator. |
Indicates unfinished work that exists in a past project. The budget is excluding this open work because the project is in the past. This signal may indicate that a project is really still underway in spite of the project end date. If so, update the end date to get the work included in the remaining budget totals. |
| Bars |
| Yellow Line Shows the amount of budget allocated across the segments of the budget. Use this to compare to the target indicator to see whether the allocations match the original budget amount. |
| Blue Shows the amount of Estimate completed. |
| Gray Shows the amount of remaining (Open) Estimate. The gray bar always shows the same level as the colored bar segment. |
| Gray and White Stripes Shows the difference between the budgeted amount and the remaining amount. |
| Orange Stripes Indicates that the budget has exceeded the targeted amount. |
Budget Structure Change Notifications
From time to time, the underlying structure of the project tree or strategic theme list used by a budget may change. When that happens, the budget will show a notice that the structure used for allocating the budget no longer matches the underlying data structure. The notice will look like this:
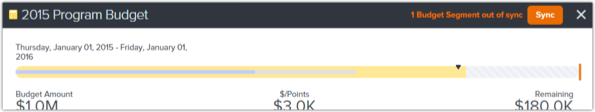
This can happen, for example when:
- a new release is added under a project-based budget
- a new strategic theme is added for a strategic theme-based budget
- a project is moved within the tree to a new parent
Members with edit access to the budget are able to resolve the difference by electing to Sync the budget to the new underlying structure.