Manage Budgets
Budgets establish spending guidelines and track development efforts against strategic targets. Teams align portfolio investments with strategic priorities and monitor progress across projects and themes.
Permission requirement: Creating and managing budgets requires Project Admin or Portfolio Manager permissions. All users with portfolio access can view budgets and budget indicators.
Who Uses Budgets
Budgets support multiple roles in portfolio financial planning:
- Portfolio Managers create budgets, allocate spending across themes and projects, and monitor budget performance against strategic targets.
- Program Managers track program-level spending and ensure development efforts stay within allocated budgets.
- Product Owners view budget allocations to understand spending priorities and make informed decisions about feature prioritization.
- Executives review high-level budget performance to assess portfolio investment alignment with organizational goals.
Budget Capabilities
- Create budgets by strategic theme or project hierarchy
- Allocate budget amounts across portfolio segments
- Track spending and progress against budget targets
- Set up multiple budget models and scenarios
- Monitor budget performance with visual indicators
- Edit and update budgets as requirements change
Access budgets
Navigate to the Budgets page to manage all your budget activities.
How to access budgets
- Click the hamburger icon
 > Portfolio > Budgets.
 - View all existing budgets in your portfolio.
- Select specific budgets to view, edit, or manage.
Budget organization options
- Strategic Themes: Align spending with strategic priorities
- Project Tree: Divide portfolio budgets across programs and projects
- Multiple models: Create different budget scenarios and versions
- Time periods: Define budgets for specific durations and timeframes
Create a budget
Set up new budgets to establish spending guidelines for your portfolio segments.
How to create a budget
- From the Budgets page, click Create New Budget.
- In the Create New Budget dialog, provide these details:
- Name: Enter a descriptive budget name
- Begin Date: Set the budget start date
- Duration: Specify length in days, weeks, or months
- Allocation method: Choose Projects or Strategic Themes
- Scope: (Optional) Limit to specific program projects
- Select your budget definition method:
- Points: Budget by story points or estimates
- Swag: Budget by high-level estimates
- Enter the Total Budget Value in estimate units, percentage, or currency.
- Click Save to proceed to allocation.
Budget creation tips
- Descriptive names: Use clear names that indicate purpose and timeframe
- Appropriate scope: Choose Projects for hierarchical budgets, Strategic Themes for priority alignment
- Realistic values: Base total budget on historical data and capacity
- Multiple scenarios: Create different budget versions for comparison
Allocate budget to segments
Distribute your total budget across project segments or strategic themes to track spending at a granular level.
How to allocate budget amounts
- From the Budgets page, click View on the budget tile.
- For each budget segment row, enter the amount in the Budget Amount field.
- Click Save to store the allocation.
- Review the allocation summary and distribution charts.
Understanding the "None" segment
Items may appear in a "None" budget segment when:
- Missing assignments: Items lack parent Portfolio Items or Strategic Themes
- Scope issues: Parent Portfolio Items exist but are outside budget scope
- Level mismatches: Items moved from different planning levels with incompatible assignments
Allocation best practices
- Complete coverage: Ensure all relevant segments have budget allocations
- Realistic distribution: Base allocations on team capacity and priorities
- Regular review: Update allocations as project scope changes
- Balance monitoring: Check that total allocations don't exceed budget limits
Edit existing budgets
Modify budget details and allocations to adapt to changing requirements and priorities.
How to edit a budget
- From the Budgets page, click View on the target budget.
- Click Edit to open the budget modification dialog.
- Update the required budget details:
- Modify name, dates, or duration
- Adjust total budget value
- Update allocation amounts
- Click Save to apply changes.
Edit limitations
- Allocation method: Cannot change between Projects and Strategic Themes after creation
- Budget units: Cannot modify units (Points, Percentage, Currency) after creation
- Workaround: Delete and recreate budget if method or units need changing
When to edit budgets
- Scope changes: Project requirements or priorities shift
- Timeline adjustments: Start dates or duration need modification
- Budget increases: Additional funding becomes available
- Reallocation: Need to redistribute amounts across segments
Delete budgets
Remove outdated or unnecessary budgets to maintain a clean portfolio view.
How to delete a budget
- From the Budgets page, locate the budget to remove.
- Click the more-actions
 icon for that budget.
 - Select Delete Budget from the menu.
- Click Delete in the confirmation dialog to proceed.
Deletion considerations
- Permanent action: Deleted budgets cannot be recovered
- Impact assessment: Review dependencies before deletion
- Data backup: Export budget data if needed for records
- Alternative options: Consider editing instead of deleting for minor changes
Understand budget indicators
View and interpret all visual indicators on the Budget Details page to track budget performance and progress against targets.
Access budget details
- Click the hamburger icon > Portfolio > Budgets
- Click View for the budget you want to review
- Hover over charts and bars for detailed totals
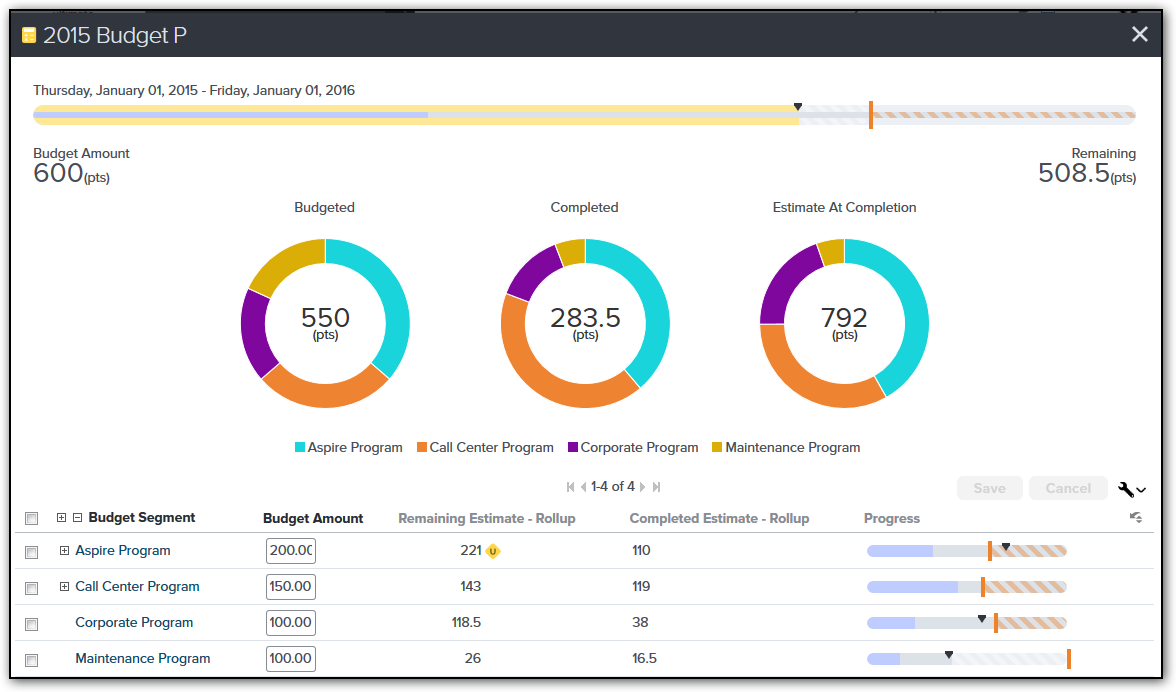
Understand the summary bar
The summary bar at the top displays overall budget status as a progress bar showing allocations and progress.
To see budget and progress details, hover over the summary bar or any chart.
| Color or Indicator | Indicates |
|---|---|
| Vertical Orange Bar | The amount of the budget |
| Yellow Vertical | The total amount allocated to the budget segments |
| Dark Blue | The amount of backlog-level work completed |
| Lighter Blue | The amount of remaining planned work |
| Black Triangle | The current date vs. the budget start or end |
Segment summary donut charts
Donut charts represent the relative allocation of the budget and workload across the budget segments.
| Chart Name | Indicates |
|---|---|
| Budgeted | Displays the budget amounts by budget segment. If budget amounts are entered at multiple levels of a project tree, the total includes the uppermost amount entered in a given segment of the tree (won't double count the budget amount if you make entries at multiple levels). |
| Completed | The relative amount of backlog estimate already completed within all covered budget segments |
| Estimate at Completion | The relative amount of total backlog estimate scheduled within the budget timeframe, both completed and remaining open. This is the amount currently planned to be completed at the end of the budget period. |
When budget values are entered at multiple levels of a project budget, the highest level budget entries are rolled up into the total. Entering allocations at multiple levels will not double count the values.
Row-level progress
For each strategic theme or project in the budget, the Budget Details page contains charts and progress bars to examine the amount of work actually completed and remaining.
Remaining Open Estimate is calculated as the sum of all scheduled estimate (work items scheduled into a project with an end date) that falls within the budget period. If a given project or release overlaps with the budget period, then the Open Estimate for the project or release is reduced by the same ratio as the amount of the project's overlap.
Example:
Given the following Budget and Project timeline:

Only 50% of the project's Open Estimate rolls up into the budget because only half of the project falls within the budget's timeframe.
Hover your mouse over any part of a chart or bar to see detailed totals.
Budget indicator symbols and colors
The table below explains the meaning of the bar colors and symbols that may display in the progress bars.
Indicator symbols
| Symbol | Meaning |
|---|---|
| Vertical Orange Bar (Target Indicator) | Shows the target budget capacity |
| Budget Indicator Triangle | Shows the percentage of budget time completed. The budget indicator starts moving from the left side of the bar at the beginning of the budget period and hits the right side at the end of the budget period. Use it to compare to the percentage of budget work completed. If all goes as planned, the progress of the blue bar stays with or ahead of the indicator. |
| Unfinished work marker | Indicates unfinished work that exists in a past project. The budget is excluding this open work because the project is in the past. This signal may indicate that a project is really still underway in spite of the project end date. If so, update the end date to get the work included in the remaining budget totals. |
Progress bars
| Bar Type | Meaning |
|---|---|
| Yellow Line | Shows the amount of budget allocated across the segments of the budget. Use this to compare to the target indicator to see whether the allocations match the original budget amount. |
| Blue | Shows the amount of Estimate completed |
| Gray | Shows the amount of remaining (Open) Estimate. The gray bar always shows the same level as the colored bar segment. |
| Gray and White Stripes | Shows the difference between the budgeted amount and the remaining amount |
| Orange Stripes | Indicates that the budget has exceeded the targeted amount |
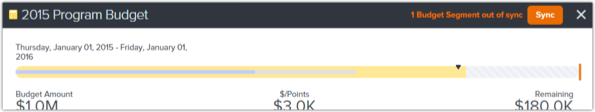
Budget structure change notifications
The underlying structure of the project tree or strategic theme list used by a budget may change over time. When that happens, the budget shows a notice that the structure used for allocating the budget no longer matches the underlying data structure.
This can happen when:
- A new release is added under a project-based budget
- A new strategic theme is added for a strategic theme-based budget
- A project is moved within the tree to a new parent
Members with edit access to the budget can resolve the difference by electing to Sync the budget to the new underlying structure.
Best practices for budget management
Effective budget planning
- Start with strategy: Align budgets with organizational priorities
- Use historical data: Base estimates on past performance and capacity
- Plan for contingency: Include buffer for unexpected changes
- Regular reviews: Schedule periodic budget assessments and updates
Monitoring and control
- Track indicators: Monitor summary bars and donut charts regularly
- Address variances: Investigate significant deviations from plan
- Communicate status: Share budget performance with stakeholders
- Adjust proactively: Update budgets before small issues become problems
Use Cases
Portfolio Manager Creating Annual Budget by Strategic Themes
A portfolio manager creates the annual budget for fiscal year 2024 covering January through December. They select "Strategic Themes" as the allocation method and choose "Points" as the budget units. The total budget is 2,000 points representing team capacity. They allocate 600 points to "Customer Experience" theme, 500 points to "Platform Modernization", 400 points to "Operational Efficiency", and 300 points to "Regulatory Compliance". The remaining 200 points stay unallocated for emerging priorities. After saving, the budget displays a yellow vertical bar at 2,000 points on the summary chart. As teams schedule stories to strategic themes throughout the year, the donut charts update showing how work distributes across themes and how completed work tracks against the allocated amounts.
Product Owner Monitoring Budget Progress Mid-Quarter
A product owner opens the Budget Details page in July to assess Q3 budget performance. The summary bar shows the budget indicator triangle at 50% (July 15 is halfway through Q3), the dark blue completed bar at 45%, and light blue remaining planned work extending to 95% of the budget. The yellow allocation line sits at 100%, indicating full allocation. They notice the "Mobile App" project shows orange stripes, meaning estimated work exceeds budget allocation by 20%. They drill into that project's backlog, finding several large stories added mid-quarter. They reprioritize 30 points worth of stories to Q4, bringing the project back within budget. The orange stripes disappear after rescheduling, and the product owner documents the adjustment for the next budget review meeting.
Finance Director Comparing Budgeted vs. Actual Using Currency Units
A finance director creates a budget using currency units to track project spending against approved funding. They set the total budget to $500,000 USD for Q2 and allocate by project tree: $200K to "E-commerce Platform", $150K to "Mobile Apps", $100K to "Data Analytics", and $50K to "Infrastructure". Each project team estimates their stories in hours, and the system converts hours to cost using configured labor rates. Mid-quarter, the director opens Budget Details and sees the "Budgeted" donut chart showing the allocation percentages. The "Estimate at Completion" donut shows E-commerce tracking at $220K (110% of budget). They meet with the E-commerce product owner to review scope, deciding to defer 40 hours of enhancement stories to Q3, bringing the project back to $195K and within the $200K budget allocation.
Scrum Master Using Percentage-Based Budget for Team Capacity
A scrum master creates a quarterly budget using percentages to represent team capacity distribution across initiatives. They set the budget period for Q1 (12 weeks) and select "Percentage" units. They allocate 40% to "Feature Development", 30% to "Technical Debt", 20% to "Defect Resolution", and 10% to "Research Spikes". Each sprint, the team assigns stories to these strategic themes. At the end of Q1, the scrum master reviews the Budget Details. The "Completed" donut chart shows actual work distributed as 42% Feature Development, 25% Technical Debt, 28% Defect Resolution, and 5% Research. The team spent less time on research and more on defects than planned. This data informs capacity planning discussions for Q2, where they increase Defect Resolution allocation to 25% based on Q1 actuals.
Executive Reviewing Budget Synchronization Alert
An executive opens a budget for review and sees a notification: "The budget structure has changed. Click Sync to update." The notification appears because a new strategic theme "AI Integration" was recently added, but the budget doesn't include it. They click the notification to view details showing the new theme has 45 points of scheduled work that's not reflected in current budget allocation. They click "Sync Budget" to incorporate the new theme. The budget editor opens, showing "AI Integration" as a new segment with 0 allocated points. They reduce "Platform Modernization" allocation from 500 to 460 points and assign 40 points to "AI Integration". After saving, the budget shows all five themes with proper allocations, and the sync notification disappears. The budget now accurately reflects the current organizational priorities.
Frequently Asked Questions
What's the difference between allocating by Strategic Themes vs. Projects?
Strategic Themes allocation groups work by business objectives regardless of which project delivers it, ideal for cross-cutting initiatives (Customer Experience, Compliance). All backlog items tagged with a strategic theme roll up into that budget segment. Projects allocation organizes the budget by the project hierarchy, ideal for product-based organizations where each project represents a distinct product or component. Choose based on how leadership views the portfolio: by business outcomes (themes) or by product structure (projects). You cannot change this after budget creation, so consider organizational reporting needs carefully.
Can I change budget units (Points, Percentage, Currency) after creation?
No, budget units cannot be changed after a budget is created. If you need different units, delete the existing budget and create a new one with the desired units. Before deleting, export budget data using the reporting features to preserve historical information. This limitation prevents data inconsistency and calculation errors that would occur from unit conversion. When creating budgets, consider whether stakeholders think in story points (development teams), percentages (capacity allocation), or currency (financial tracking) and select the appropriate unit from the start.
What does the black triangle indicator on the progress bar represent?
The black triangle shows time progress through the budget period, moving from left (budget start date) to right (budget end date). At 50% of the time elapsed, the triangle sits at the 50% mark. Compare the triangle position to the dark blue completed work bar: if completed work is ahead of the triangle, you're ahead of schedule; if behind, you're falling behind. For example, if the triangle is at 60% but completed work shows only 40%, you've used 60% of the time but completed only 40% of work, indicating a schedule risk requiring corrective action.
What happens when I see orange stripes on a budget segment?
Orange stripes indicate budget overrun: scheduled work exceeds allocated budget for that segment. This is a warning signal requiring attention. Review the affected project or theme to understand why estimates exceed the plan. Common causes include scope creep (new stories added), underestimation (original estimates too low), or shifting priorities (work moved from other areas). Address overruns by reprioritizing work to later periods, requesting budget increases, or reducing scope. The orange stripes disappear once estimated work returns to within allocated budget amounts.
How do I handle the "None" segment in Strategic Themes budgets?
The "None" segment represents backlog items not tagged with any strategic theme. While you can allocate budget to "None" to account for unthemed work, best practice is minimizing this segment by tagging all backlog items appropriately. Review items in the "None" segment regularly and assign strategic themes so work aligns with organizational priorities. A large "None" segment indicates backlog items disconnected from strategic planning, making it difficult to assess progress toward business goals. Use backlog filters to find unthemed items and assign themes during backlog grooming sessions.
Why don't my new stories appear in budget progress calculations?
Budget progress calculations use work item estimates and scheduled dates. Verify new stories have: (1) estimate values entered, (2) appropriate strategic theme tags or project assignments matching budget allocation, and (3) scheduled dates within the budget period. Stories without estimates don't contribute to budget calculations. Stories outside the budget timeframe or without proper theme/project assignments appear in the "None" segment or don't appear at all.
Related Topics
- Portfolio Planning - Plan and align portfolio items with strategic objectives
- Strategic Themes Overview - Manage strategic themes for budget allocation
- Portfolio Tree - Organize portfolio items in a hierarchical structure
- Portfolio Tracking - Monitor portfolio performance and progress
- Roadmapping - Visualize portfolio item delivery across time