SeeTestAutomation- Use Device Vitals Monitors
Please note that this tool is classified as a Legacy tool. We recommend transitioning to our updated solutions to maintain optimal performance and security in your workflows. For more information on this matter, please reach out to technical support .
Device vitals monitors enable you to view and collect data related to the devices that are being monitored as well as the applications that are running on this device.
The vitals that are being collected will give you a detailed view on the CPU and Memory being used by your application as well as other applications that are running on the device.

The monitors are being presented as a graph for easy analysis, and can also be export (CSV format), to be used by Excel.
To open the monitor dialog click on the 'Monitors' icon:
The 'Monitors' dialog will get opened.
You will find the CPU graph as well as the Memory graph. For every graph you will find an option to configure the graph as well as export the graph data
.
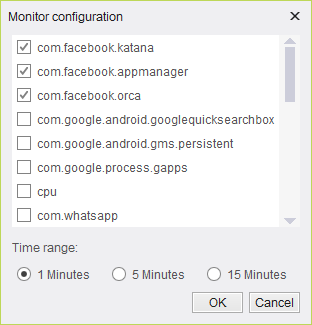
In the graph configuration you can select the applications to monitor and the time range of the graph:

When clicking on the export button you will requested to provide the file name you would like to save the data into.
To disable collection of vitals monitors, add 'monitoring.disable=true' to the application.properties file.