Sprint or Iteration Dashboard Report
This article explains how to use the Sprint or Iteration Dashboard Report.
Overview
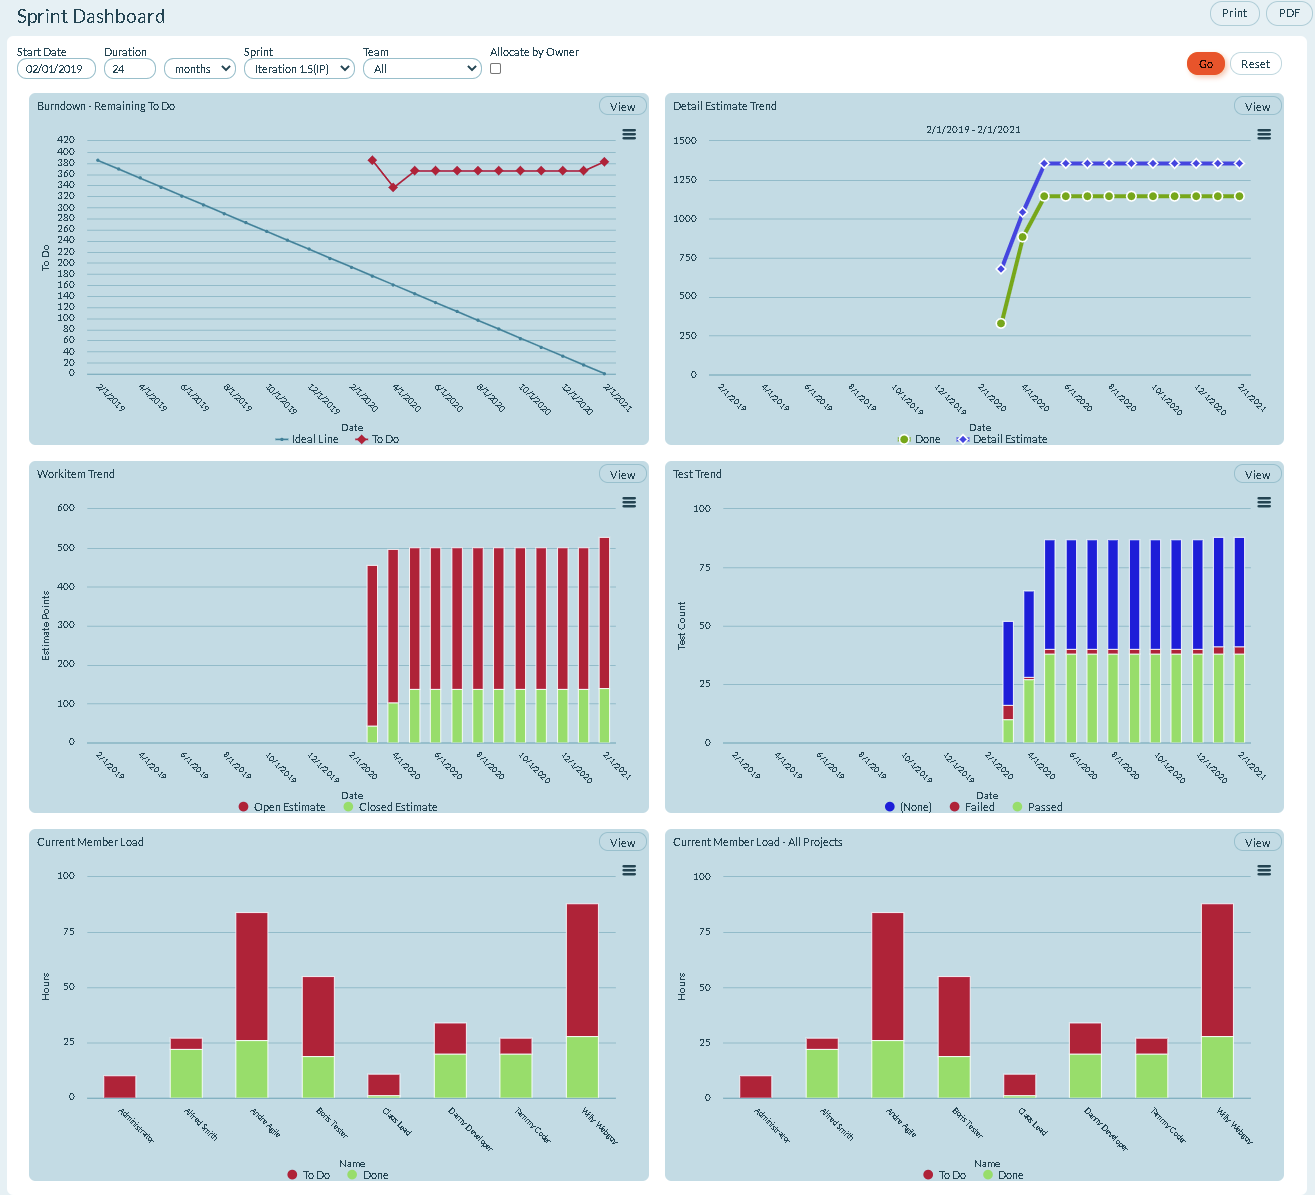
The Sprint Dashboard combines a snapshot of the following sprint-based reports into a single, consolidated view:
- Burndown - Remaining To Do: A line chart tracking remaining work (To Do hours) over time compared to the ideal burndown line
- Detail Estimate Trend: A line chart showing Done hours and Detail Estimate over the selected time period
- Workitem Trend: A bar chart displaying Open Estimate (red) and Closed Estimate (green) by date
- Test Trend: A bar chart showing test status distribution (Not Started, Developing, Ready, Testing, Failed, Passed)
- Current Member Load: A chart showing member workload (To Do vs. Done hours) for the selected iteration
- Current Member Load - All Planning Levels: A chart showing member workload across all planning levels (scopes) for the selected iteration
Project managers, team leads, and customers can use the dashboard to view team progress in the current sprint.
Understand Current Member Load Charts
The dashboard includes two member load charts at the bottom:
Current Member Load:
- Shows workload (To Do and Done hours) for team members in the selected iteration
- Filters by the specific planning level, team, or iteration selected in the report parameters
- Displays "No Data to Display or No Active Iteration" when no active iteration is selected
Current Member Load - All Planning Levels:
- Shows workload (To Do and Done hours) for team members across all planning levels (scopes)
- Aggregates work from all scopes for the selected iteration
- Displays "No Data to Display or No Active Iteration" when no active iteration is selected
Both Current Member Load charts display work only from the selected iteration or sprint, not the entire Program Increment (PI) or backlog. The "All Planning Levels" chart aggregates work across multiple scopes/planning levels within that iteration, while the standard chart shows a filtered view based on your selected parameters.
Where to find this report
- Click the hamburger menu
 > Reports > All Reports.
 - In the Sprint Reports section, click Member Dashboard.
Report Filters or Parameters
- Start Date: Shows data from the sprint or iteration start date.
- Duration: Shows data for the selected duration (days, weeks, or months).
- Sprint or Iteration: Shows data assigned to the sprint or iteration. The default value is "All".
- Team: Shows Team-specific data for the project or program. The default value is "All" or "Blank".
- Allocate by Owner: Segments report data by owner.
Related concepts
Using Tasks to Breakdown Stories Backlog Items