Project Dashboard Report
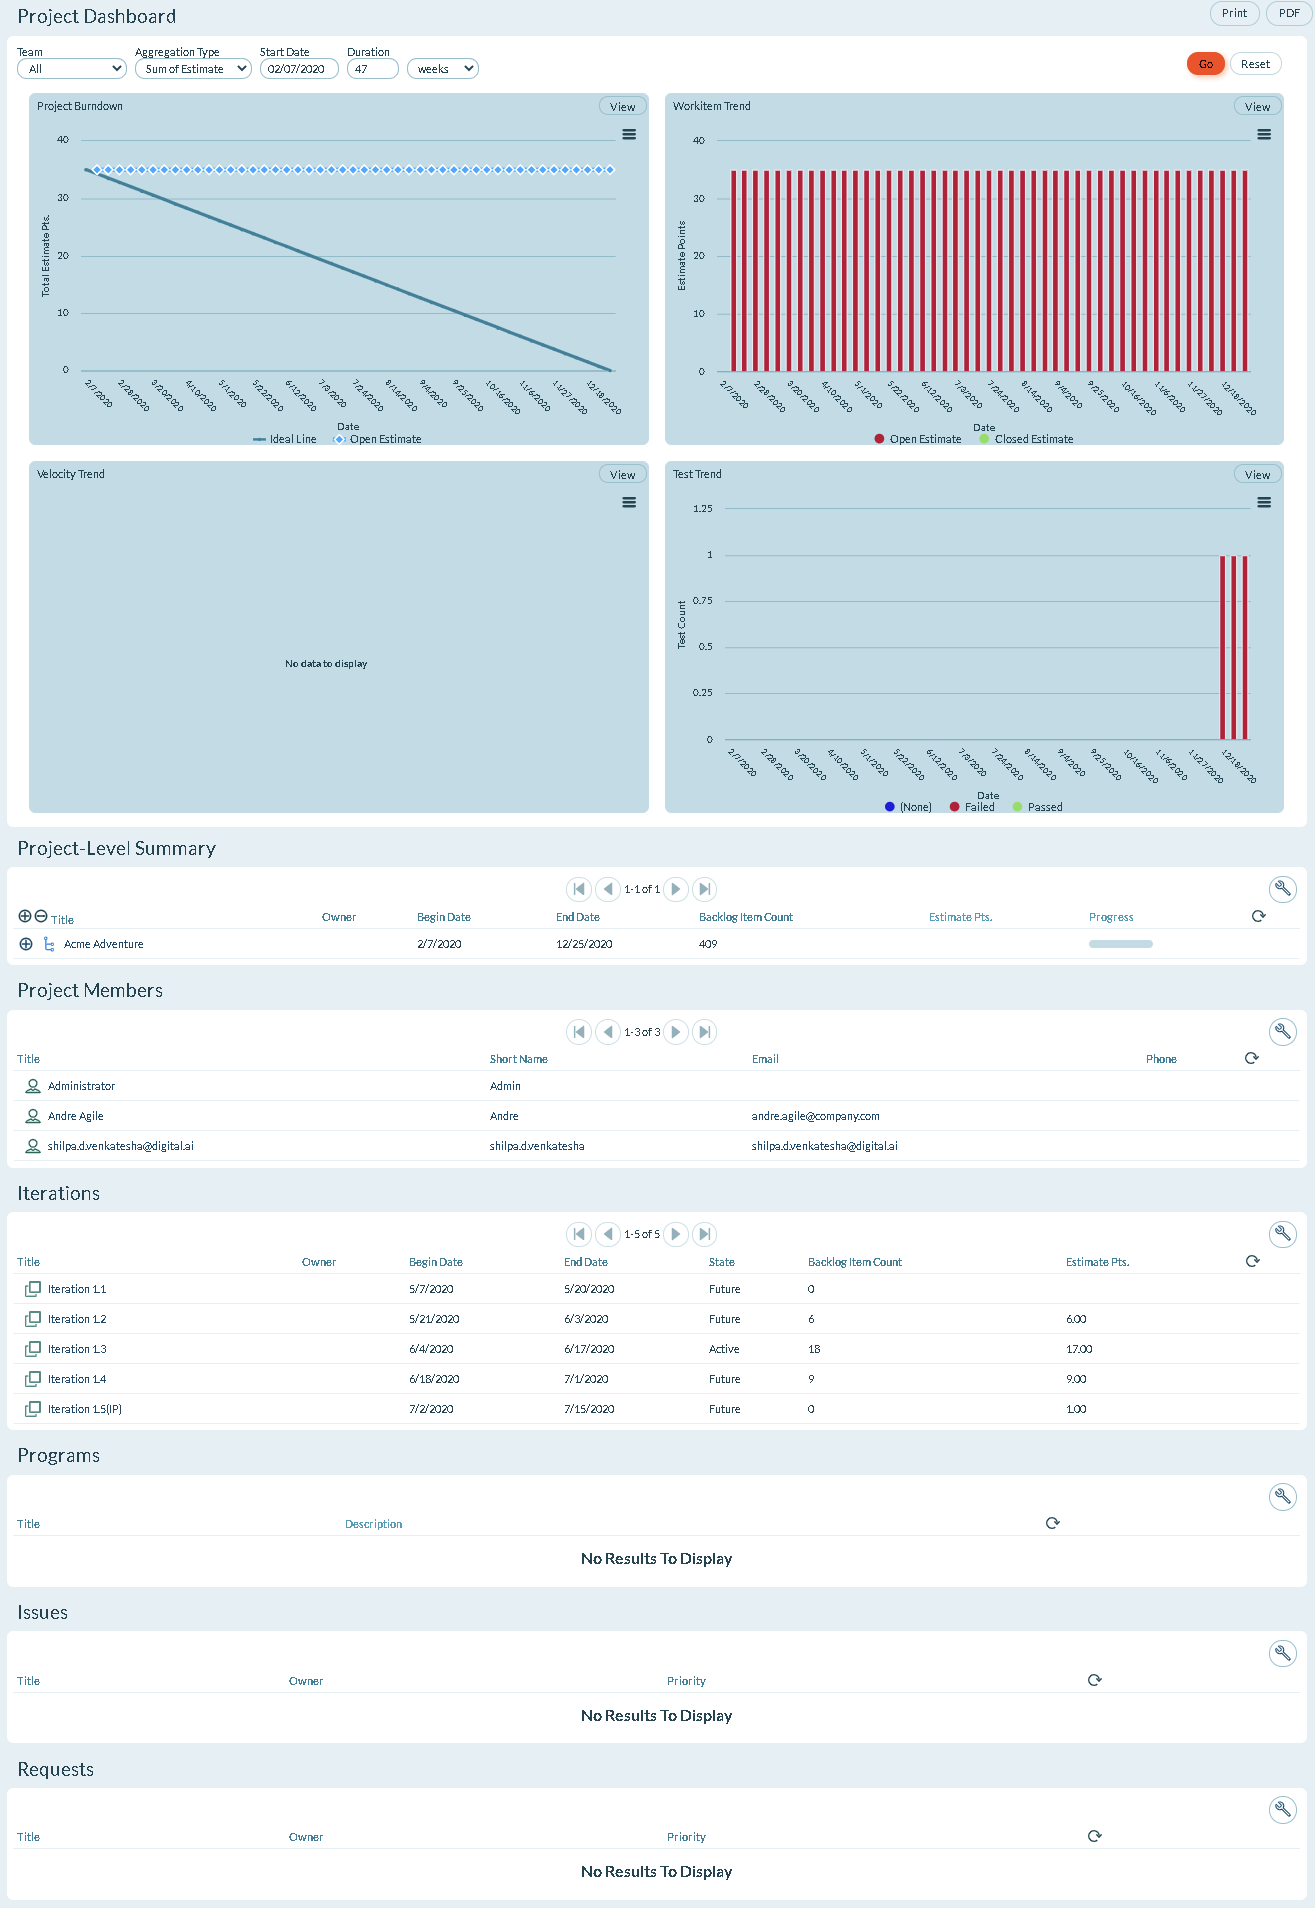
The Project Dashboard combines a snapshot of these project or release-level reports into a single, consolidated view. Use this report to view the current status and recent work in a project or release.

Project Dashboard Panels
The Project dashboard shows the following charts:
- Project or Release Burndown Report
- Workitem Trend Report
- Velocity Trend Report
- Test Trend Report
- Project or Program Summary Report
The chart data is summarized by the selected duration.
Generating the Project Dashboard Report
-
Click the hamburger menu
> Reports > All Reports.
-
In the Executive Reports or Project or Release Reports sections, click Project Dashboard.
-
Select any of the following filters (or use the default filters) and click Go.
-
- To clear filters, click Reset.
Report Filters or Parameters
-
Team: Shows Team-specific data for the project or program. The default value is "All" or "Blank".
-
Aggregation Type: Determines how the data is aggregated. Valid values are:
-
- Total Estimate - Sum the Estimate values.
- Workitem Count - Count of work items regardless of estimate value.
-
Start Date: The first date the report begins calculating data.
-
- For project-based reports, the default start date is the project start date.
- For sprint or iteration-based reports, the default start date is the sprint or iteration start date.
- For member-based reports, the default start date is 13 weeks prior to the current date.
- If the start date is set to the current date or later, no data displays.
-
Duration: The number of days, weeks, or months to display.
-
- For project-based reports, the default duration is the number of weeks from the project's start date to today.
- For sprint or iteration-based reports, the default duration is the number of days in the sprint or iteration.
- For member-based reports, the default duration is 13 weeks.
- The report ends at the current date, so if the selected start date and duration extend past the current date, no data displays after the current date.
Customizing the Project Dashboard
You an customize this dashboard to include other data relationships. Click on the Customize link in the Relationships section to see the display options.