Release Application Deployment Maturity
The Release Application Deployment Maturity dashboard provides a snapshot view of your application maturity in terms of how mature an application deployment is of Digital.ai Release. This dashboard provides an overview of the current month's application growth from the deployment point of view. You can compare the annual growth percentage of applications and the associated deployments and environments. The dashboard data is fetched based on parameters such as application added, applications deployment activity, applications maturity in terms of deployment in production, and application maturity when the application is deployed in multiple environments.
Using this dashboard, the Platform Engineering or DevOps Manager can monitor and analyze the following business scenario:
- Examine the application maturity in terms of deployment over the last thirteen months or thirteen weeks of data?
- Identify the issues or delays related to the application deployment process and provide support to resolve them?
- Success rate of application deployment processes.
- Actual and average growth in application deployment.
The Release Application Deployment Maturity dashboard is built using the Release last refresh datetime, Release application maturity new applications, Release application maturity task type deployment, and Release Security Dataset datasets.
The Release Application Deployment Maturity panel consists of the following sections:
- KPIs: By default, the KPIs listed on this dashboard show the value for the current month. The following KPIs are driving the sections in the monthly and weekly panels:
- Applications Used: The total number of Applications on-boarded.
- Applications More Than 1 Deployment: The number of applications with deployments associated to more than one environment type.
- Applications More Than 2 Environments: The number of applications with deployments associated to more than two different environment types.
- Applications with PROD deployment: The number of applications where the deployments are associated with the production environment.
- Applications with Failure Rate > Ideal: The count of applications where the deployment failure rate is greater than a defined acceptable target failure rate.
- Monthly Panel: The information on this Monthly panel covers the last 13 months data. Using this panel, you can drill down into the Monthly KPIs and the associated release details.
- Weekly Panel: The Weekly panel provides the data of the last 13 weeks. Using this panel, you can drill down into the Weekly values and the associated release details.
Applications Used
The dashboard displays the section related to the Applications Used KPI by default. Following are the sections related to this KPI:
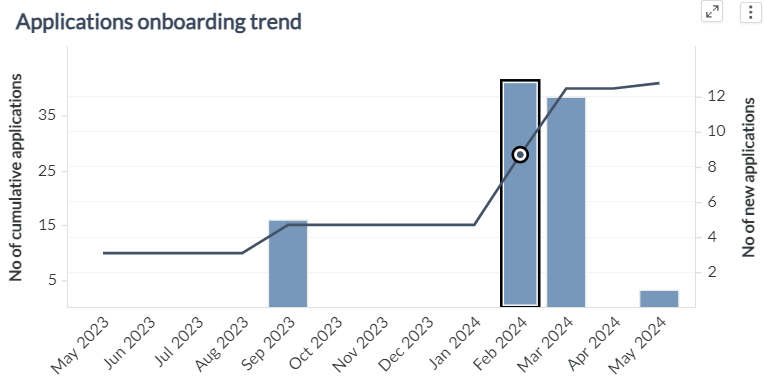
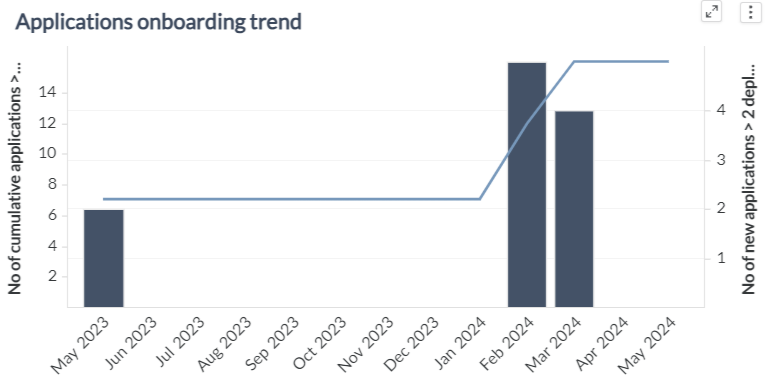
Applications Onboarding Trend
The Applications Onboarding Trend section in the Monthly or Weekly panel provides the trend of new applications compared to cumulative applications. The X-axis represents the calendar month or week, and Y-axis represents the number of new and cumulative applications accordingly. You can drill down to a specific month's or week's data by selecting the required month or week from the graph.
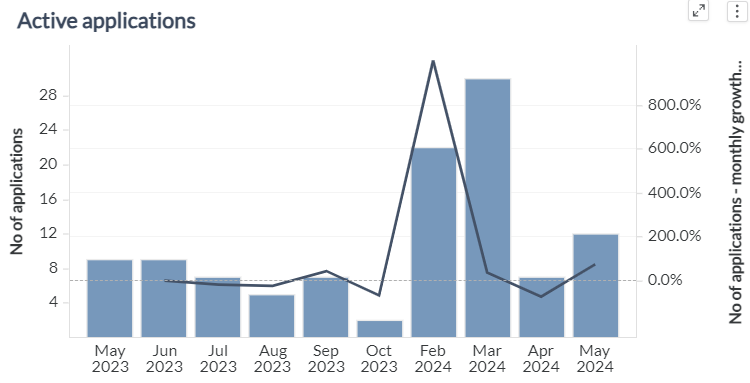
Active Applications
The Active Applications section in the Monthly or Weekly panel provides the trend of the number of applications from release task type deployment and their monthly or weekly growth. The graph's Y-axis displays the number of applications from release task type deployment and their growth percentages, while the X-axis shows the calendar months or weeks accordingly.
New Applications of Selected Month or Week
The New Applications of Selected Month or Week section displays the details of the newly added applications for a specific month or week, along with Release Task Application, First Deployed Date, Last Deployed Date, Last Deployed Version, Last Deployed Environment, Number of Deployments, and the Number of Failed Deployments associated with the newly added applications in the Monthly or Weekly panel respectively. You can select an individual application to view the associated release details. The data in this section is driven by the Applications Onboarding Trend section.
Deployment Task Details of Selected Application
The Deployment Task Details of Selected Application section in the Monthly and Weekly panel, provides the release task related details such as the Task Name, Environment Name, Environment Stage, Version, Actual End Date, and the Actual Start Date associated with the selected application. The data in this section is driven by the New Applications of Selected Month or Week section.
You can also click the ![]() icon against the release task to launch the source system and view more details about the release.
icon against the release task to launch the source system and view more details about the release.
Applications More Than 1 Deployment
You can view the detailed information in the Monthly and Weekly Panels by clicking the Applications More Than 1 Deployment from KPIs option. Click the Monthly or Weekly panel to load the corresponding data in the panel.
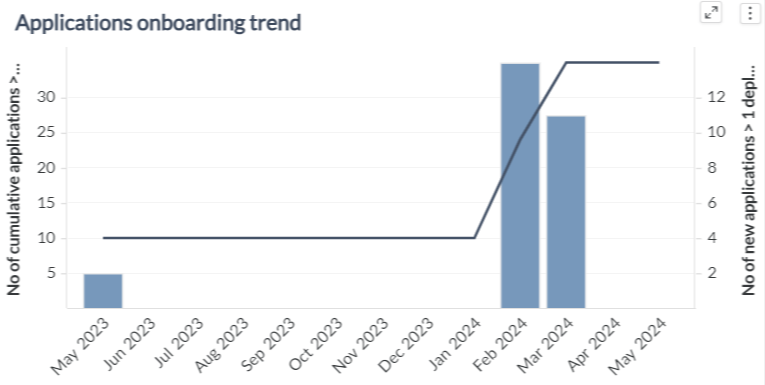
Applications Onboarding Trend
The Applications Onboarding Trend section in the Monthly or Weekly panel provides the trend of new applications with more than one deployment compared to cumulative count of applications with more than one deployment. The X-axis represents the calendar month or week, and Y-axis represents the count of new and cumulative applications with more than one deployment accordingly. You can drill down to a specific month's or week's data by selecting the required month or week from the graph.
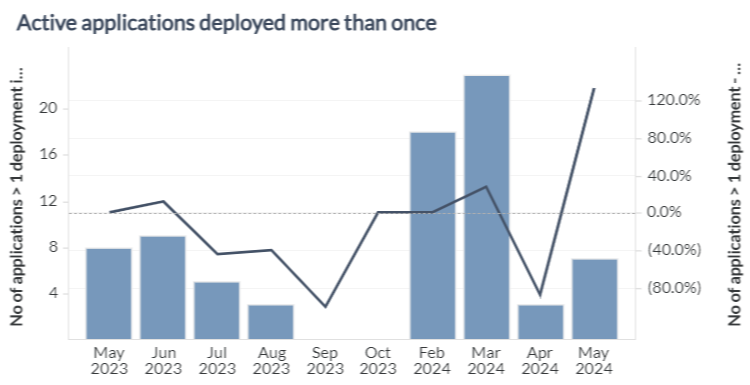
Active Applications Deployed More Than Once
The Active Applications Deployed More Than Once section in the Monthly or Weekly panel provides the trend of the applications associated with more than one deployment irrespective of the environment and their monthly or weekly growth. The graph's Y-axis displays the number of applications >1 deployed environment and their growth percentages, while the X-axis shows the calendar months or weeks accordingly.
New Applications > 1 Deployments to any Environment of Selected Month or Week
The New Applications >1 Deployment to any Environment of Selected Month or Week section displays the details of the newly added applications with more than one deployment irrespective of the environment for a specific month or week. Additionally, this section helps us with the details of Application Name, Last Deployed Version, Last Deployed Environment, No of Deployments, and the No of Failed Deployments associated with the newly added applications in the Monthly or Weekly panel respectively. You can select an individual application to view the associated release details. The data in this section is driven by the Applications Onboarding Trend section.
Deployment Task Details of Selected Application
The Deployment Task Details of Selected Application section in the Monthly and Weekly panel, provides the release task related details such as the Task Name, Environment Name, Status, Version, Release Name, and the Actual Duration associated with the selected application. The data in this section is driven by the New Applications > 1 Deployment to any Environment of Selected Month or Week section.
You can also click the ![]() icon against the release task to launch the source system and view more details about the release.
icon against the release task to launch the source system and view more details about the release.
Applications More Than 2 Environments
You can view the detailed information in the Monthly and Weekly Panels by clicking the Applications More Than 2 Environments from KPIs option. Click the Monthly or Weekly panel to load the corresponding data in the panel.
Applications Onboarding Trend
The Applications Onboarding Trend section in the Monthly or Weekly panel shows the trend of new and cumulative count of applications with deployments associated to more than two environments. The X-axis represents the calendar month or week and Y-axis represents the count of new and cumulative applications deployments associated with more than two environments accordingly. You can drill down to a specific month's or week's data by selecting the required month or week from the graph.
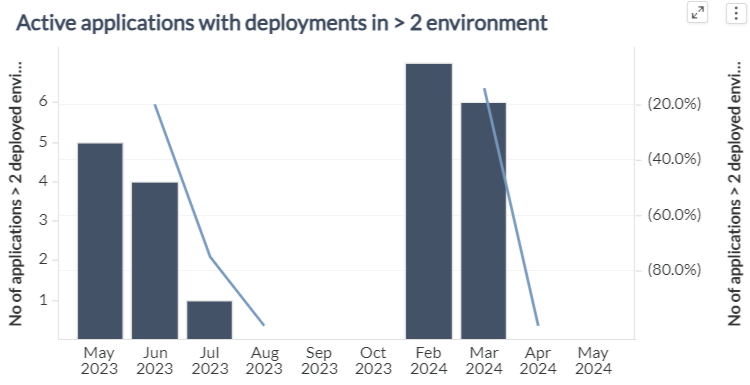
Active Applications with Deployments in >2 Environments
The Active Applications with Deployments in >2 Environment section in the Monthly or Weekly panel provides the trend of the applications deployments associated with more than two environments and their monthly or weekly growth. The graph's Y-axis displays the number of applications of more than two deployed environments and their growth percentages, while the X-axis shows the calendar months or weeks accordingly.
New Applications with Deployments in > 2 Environment of Selected Month or Week
The New Applications with Deployments > 2 Environment of Selected Month or Week section displays the details of the newly added application deployments associated with more than two environments for a specific month or week. Additionally, this section helps us with the details of Application Name, Last Deployed Version, Last Deployed Environment, Number of Deployments and the Number of Failed Deployments. You can select an individual application to view the associated release details. The data in this section is driven by the Applications Onboarding Trend section.
Deployment Task Details of Selected Application
The Deployment Task Details of Selected Application section in the Monthly and Weekly panel, provides the release task related details such as the Task Name, Environment Name, Status, Version, Release Name, and the Actual Duration associated with the selected application. The data in this section is driven by the New Applications with Deployments > 2 Environment of Selected Month or Week section.
You can also click the ![]() icon against the release task to launch the source system and view more details about the release.
icon against the release task to launch the source system and view more details about the release.
Applications with PROD deployments
You can view the detailed information in the Monthly and Weekly Panels by clicking the Applications with PROD deployments from KPIs option. Click the Monthly or Weekly panel to load the corresponding data in the panel.
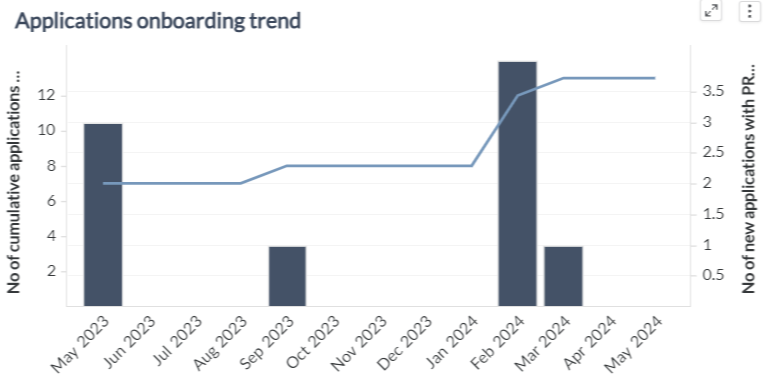
Applications Onboarding Trend
The Applications Onboarding Trend section in the Monthly or Weekly panel shows the monthly or weekly trend of new and cumulative count of applications deployed to Production. The X-axis represents the calendar month or week and Y-axis represents the count of new and cumulative applications deployments to PROD accordingly. You can drill down to a specific month's or week's data by selecting the required month or week from the graph.
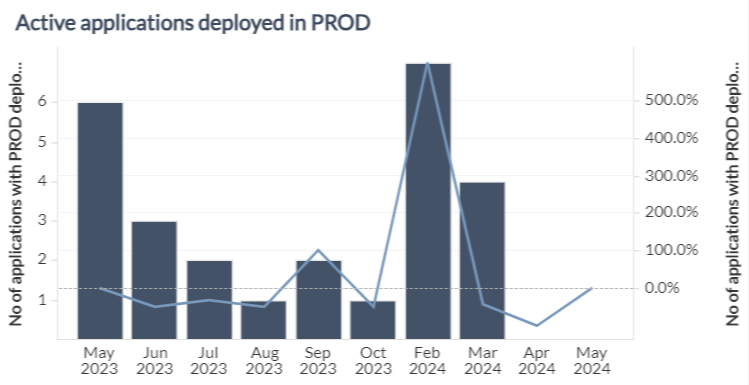
Active Applications Deployed in PROD
The Active Applications Deployed in PROD section in the Monthly or Weekly panel provides the trend of the applications deployments to PROD and their monthly or weekly growth. The graph's Y-axis displays the number of applications associated with PROD deployments and their growth percentages, while the X-axis shows the calendar months or weeks accordingly.
New Applications with Deployments in PROD of Selected Month or Week
The New Applications with Deployments in PROD of Selected Month or Week section displays the details of the newly added applications associated with PROD deployments for a specific month or week. Additionally, this section helps us with the details of Application Name, Last Deployed Version, Last Deployed Environment, Number of Deployments, and the Number of Failed Deployments. You can select an individual application to view the associated release details. The data in this section is driven by the Applications Onboarding Trend section.
Deployment Task Details of Selected Application
The Deployment Task Details of Selected Application section in the Monthly and Weekly panel, provides the release task related details such as the Task Name, Environment Name, Status, Version, Release Name, and the Actual Duration associated with the selected application. The data in this section is driven by the New Applications with Deployments in PROD of Selected Month or Week section.
You can also click the ![]() icon against the release task to launch the source system and view more details about the release.
icon against the release task to launch the source system and view more details about the release.
Applications with Failure Rate > Ideal
You can view the detailed information in the Monthly and Weekly Panels by clicking the Applications Where Deployment Failure Rate More Than Ideal from KPIs option. Click the Monthly or Weekly panel to load the corresponding data in the panel.
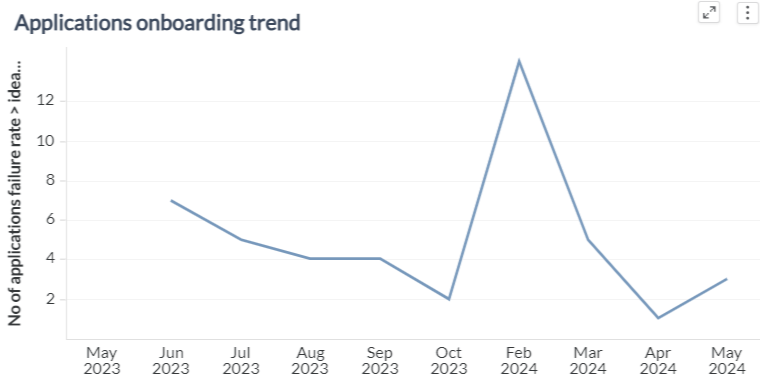
Applications Onboarding Trend
The Applications Onboarding Trend section in the Monthly or Weekly panel shows the trend of applications count where deployment failure rate is more than ideal. The X-axis represents the calendar month or week and Y-axis represents the count of applications where deployment failure rate more than ideal accordingly. You can drill down to a specific month's or week's data by selecting the required month or week from the graph.
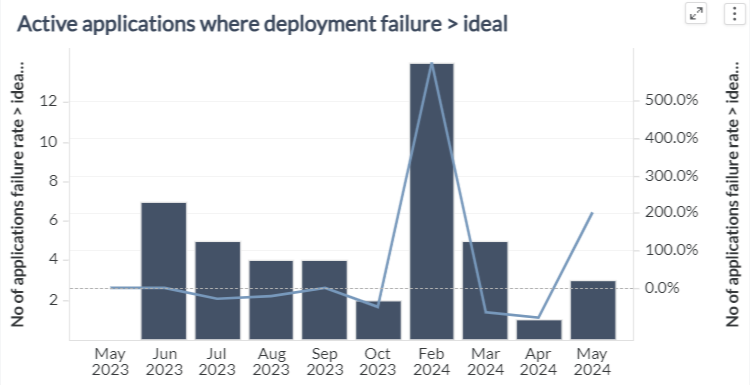
Active Applications where Deployment Failure > Ideal
The Active Applications where Deployment Failure > Ideal section in the Monthly or Weekly panel provides the monthly or weekly trend of the applications with deployment failure rate is greater than expected and their monthly or weekly growth rate. The graph's Y-axis displays the application count and their growth percentages, while the X-axis shows the calendar months or weeks accordingly.
Applications where Deployment Failure > Ideal of Selected Month or Week
The Applications where Deployment Failure > Ideal of Selected Month or Week section displays the details of the newly added applications with deployment Failure is greater than ideal value for a specific month or week. Additionally, this section helps us with the details of Application Name, Last Deployed Version, Last Deployed Environment, Number of Deployments, and the Number of Failed Deployments. You can select an individual application to view the associated release details. The data in this section is driven by the Applications Onboarding Trend section.
Deployment Task Details of Selected Application
The Deployment Task Details of Selected Application section in the Monthly and Weekly panel, provides the release task related details such as the Task Name, Environment Name, Status, Version, Release Name, and the Actual Duration associated with the selected application. The data in this section is driven by the New Applications with Deployments > 2 Environment of Selected Month or Week section.
You can also click the ![]() icon against the release task to launch the source system and view more details about the release.
icon against the release task to launch the source system and view more details about the release.
Objects used in this dashboard
This section lists all the attributes and metrics used to build the reports in this dashboard.
Attributes
| Attribute Name | Description |
|---|---|
| Actual End date | The date when release task is actually ended |
| Actual Start date | The date when release task is actually started |
| Application | Name of the Application linked to Release Task Attribute Type Deployment |
| Calendar Month | Gregorian calendar month |
| Environment Name | Name of the environment which is linked to Release Task attribute type Deployment |
| Environment Stage | Stage of the environment which is linked to Release Task attribute type Deployment |
| First Deployed Date | First date of the application deployed |
| Last Deployed Date | Last date of the application deployed |
| Last Deployed Environment | Environment of release task application last deployed |
| Last Deployed Version | Latest version of release task application deployed |
| Name | Title of a Release task |
| Release Name | Title of a Release |
| Release Task URL | Source System url link to navigate directly |
| Release Task Status | Current status of the release task |
| Version | Version of Application which was deployed and linked to Release task type attribute |
Metrics
| Metric Name | Description | Metric Formula |
|---|---|---|
| % Unsuccessful Deployments | Ratio of unsuccessful deployments out of all completed deployments | [No of Unsuccessful Deployments from Release Task Type Deployment] / [No of Completed Deployments from Release Task Type Deployment] |
| Actual Duration | Average of the duration of all tasks where duration is the time between Actual Start and Actual End Date of the task | [Release Task Actual Duration From Release Task Type Deployment] / (86400 * [No of Release Tasks from Release Task Type Deployment]) |
| Applications more than 2 environments | Number of new applications deployed across more than two environments per month | Max([No of Cumulative Applications > 2 Deployed Environment in Month from Deployment Application Daily]) |
| No of Applications | The number of applications deployed | Max([No of Applications from Deployment]) |
| No of Applications - monthly growth (%) | Monthly growth count of applications from deployments compared to previous month | ([No of Applications from Deployment] - [No of Applications from Deployment - Previous Month]) / [No of Applications from Deployment - Previous Month] |
| No of Applications > 1 Deployment in month | Number of applications that were deployed to more than one environment per month | Max([No of Applications from Deployment]) <[Deployment Count from Deployment (Application, Calendar Month)>1]> |
| No of Applications > 2 Deployed Environments in Month | Number of applications that were deployed to more than two environments per month | Max([No of Applications from Deployment]) <[Environment Count from Deployment (Application, Calendar Month)>2]> |
| No of Applications Failure Rate > Ideal in Week | Count of applications where deployment failure rate is more than a defined acceptable target failure rate | Sum(Case([Failure rate by {week,application}]>0.05), 1, 0)) |
| No of Deployments | Number of deployments attempted for a particular release | Count (No of Deployments) |
| No of Failed Deployments | Count of deployments whose status are Failed | Count([No of Deployments]) <[Deployment=FAILED]> |
| No of New Applications | Count of new applications | Max([No of New Applications from Deployment Application Daily]) |
| No of New Applications > 1 deployment in month | Number of new applications that were deployed to more than one environment per month | Max([No of New Applications > 1 Deployments in Month from Deployment Application Daily]) |
| No of New Applications > 2 Deployed Environments in Month | Number of new applications that were deployed to more than two environments per month | Count<Distinct=True>([New application more than 2 deployed environments in month]) |
| No of New Applications with PROD Deployments | Count of new applications with production deployments | Max([No of New Applications with PROD Deployments]) |