Debug an Appium Session
This article explains how to run automated tests on a device that you have already opened from a web desktop browser.
To debug a test that is actively running, see Debug A Test Request
If you already have some experience, and understand how to open a device for automation mode, you can skip the first items and continue from here.

-
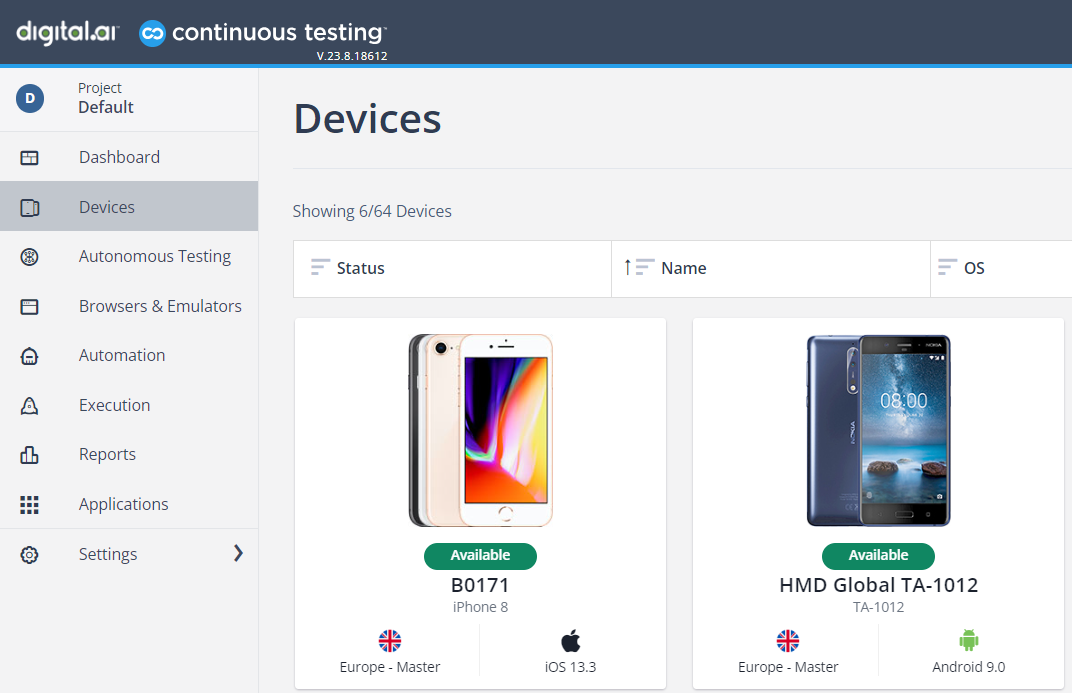
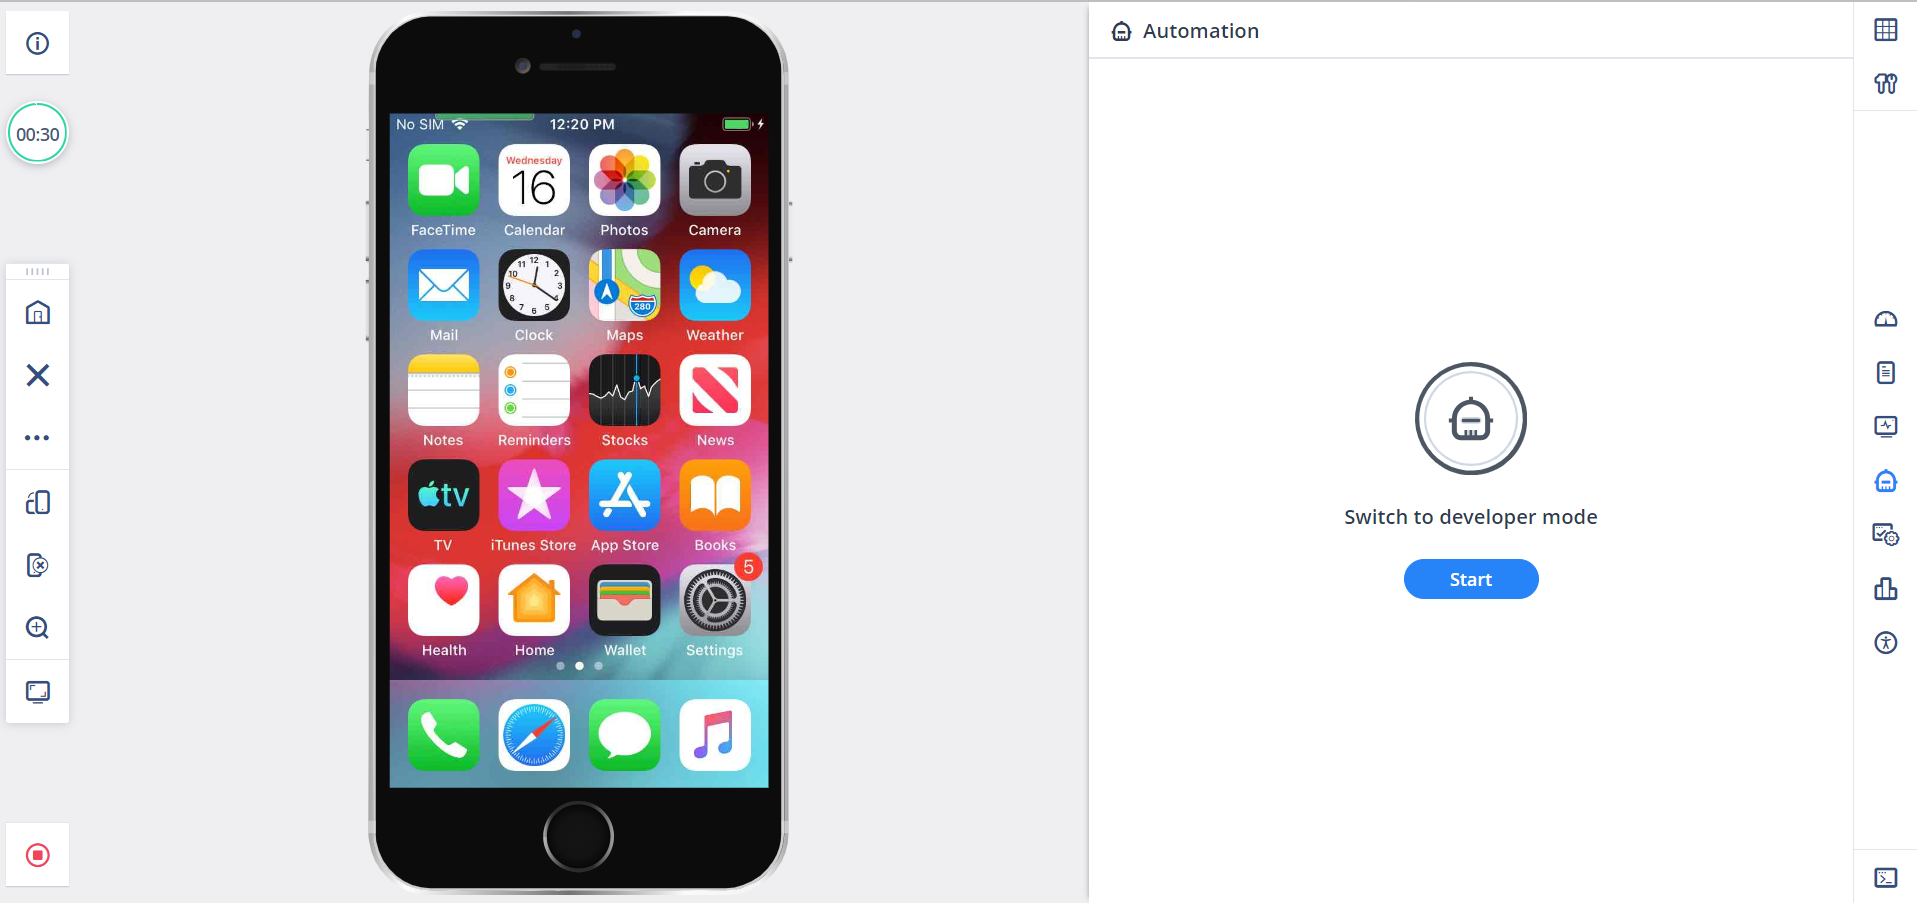
Click Open. A new page opens a browser tab. It has two sections, the left side of the page has the device and operations which can be performed on it. The section on the right side displays useful utility operations such as viewing logs and automation.
-
On right side of the screen, click Automation > LET'S START AUTOMATING.

You get a screen that looks like the screen below.

-
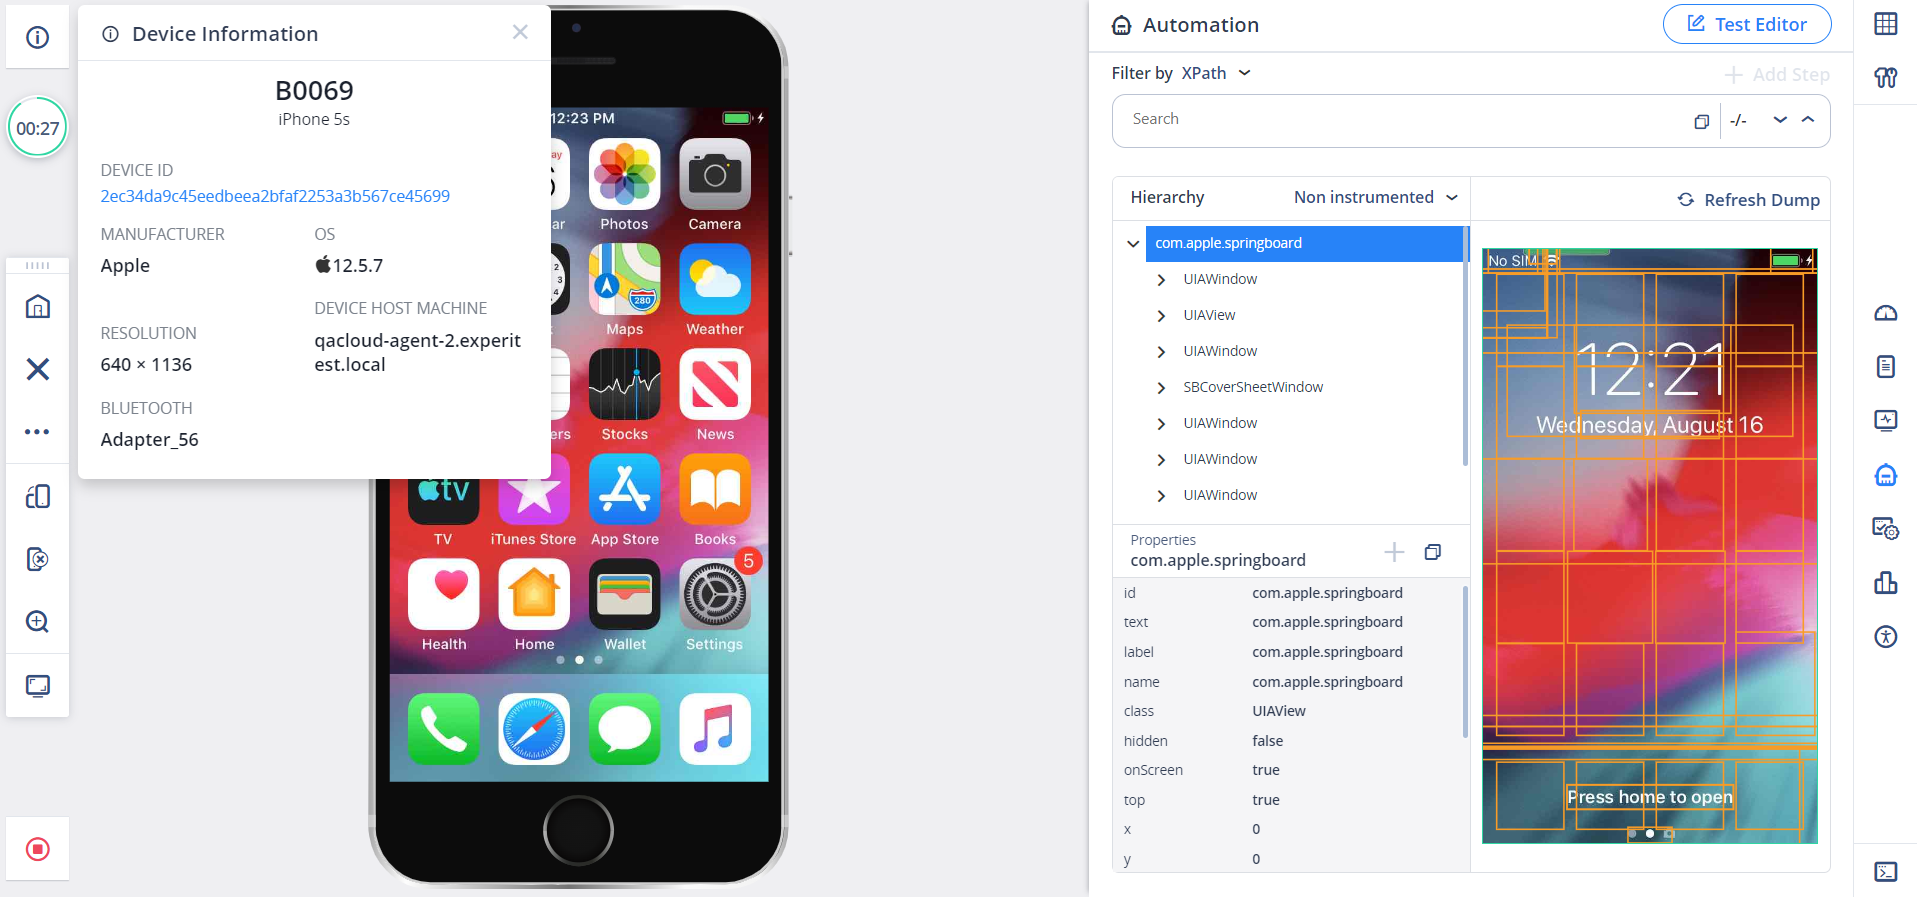
Copy the Device ID. The device is reserved and ready to run Automation.
Run the Automation Tests
Add the desired capability requesting to run your test on this specific device.
Testbase Modification
/**
 * Initialize default properties.
 */
protected void initDefaultDesiredCapabilities() {
        dc.setCapability(MobileCapabilityType.UDID, "FA69TBN03839");
}
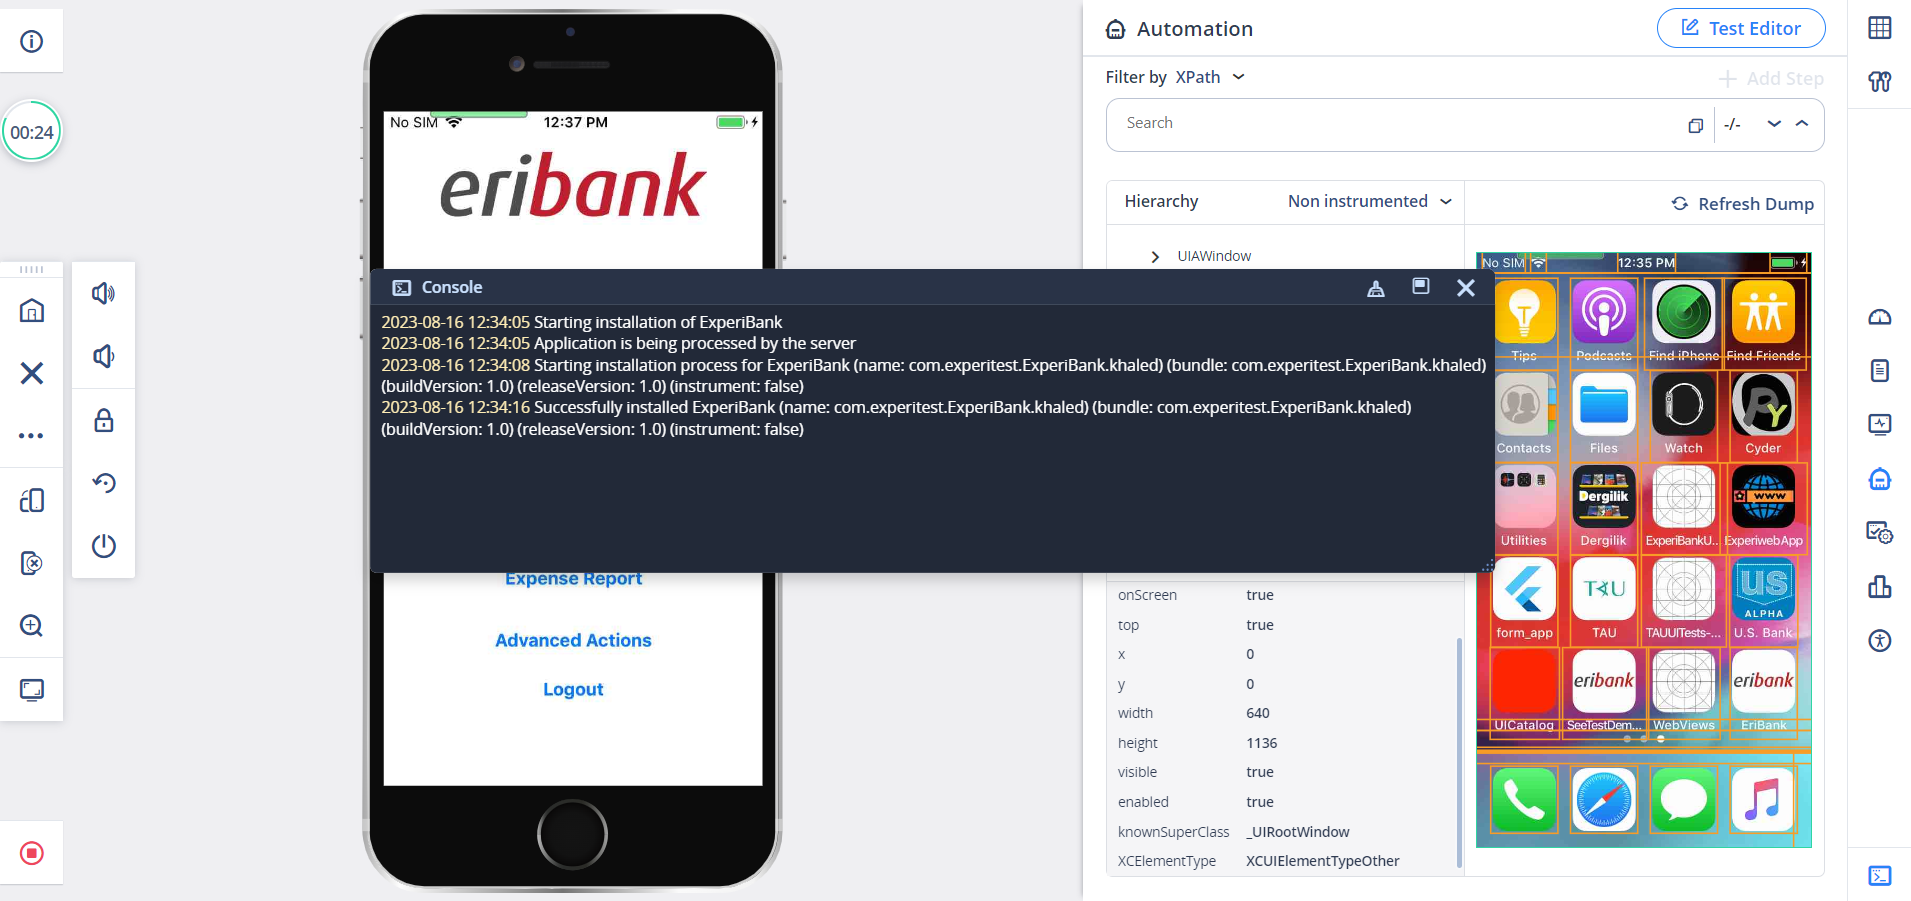
Once your tests execute, you can follow the console log on the device screen. It prints out all the commands executed by the Appium Grid Node.

During the execution of the test from the code environment, you can place breakpoints in order to pause the execution and better investigate the application state, fetch dump, and interact with the device.
If the test is paused for more time than defined in newCommandTimeout capability, the Appium server session resets.
The default value of newCommandTimeout is 60 seconds.
While debugging a test it is better to provide a greater value for this capability. If driver.quit is not called, you can only execute the next test when the timeout is reached.
After the test is completed, the device web session stays open and subsequent tests can use it. You can find more info on running a test on a reserved device here.