Mobile Studio - Simulating Different Network Conditions
Knowing how your application behaves under different network conditions allows you to improve the behavior of the application for a better user experience. It is also useful for the user to know which network the device is connected while they interact with your mobile website or application.
When testing your application or mobile website in manual mode, you can monitor network traffic and data upload and download rates. You can also select different network profiles to simulate different network conditions.
Open the Network Console
-
Opened the device in manual mode.
-
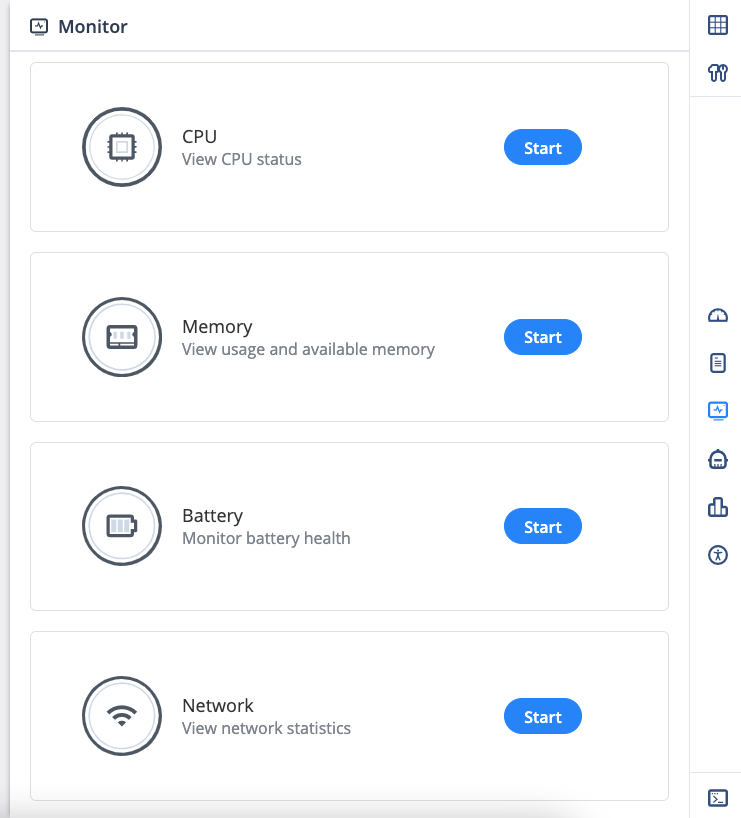
In the Utilities section click Monitors.

-
In the Network section click Start.
Read Data from the Network Console
The network console shows two separate graphs, marked by a blue graph line and a red one.
The blue graph represents downloaded data. This indicator lets you know how much data was downloaded to the device. For example, a user opened your website's homepage and the browser downloaded the all the required resources such as the DOM and images.
The red graph represents uploaded data. This indicator lets you know how much data was uploaded. For example, a user uploaded a profile picture to their account.
Knowing how much data is downloaded or uploaded can then help you make decisions regarding how to minimize the amount of data that is downloaded, or how to handle cases where a heavy upload action takes place.
Downloaded Data

Uploaded Data

Simulate Different Network Conditions
You simulate different network conditions and see how your site or app behave under these conditions. To do so, select the desired network profile.
