Mobile Studio - Monitoring
After a device is opened, you can access monitoring by clicking the Monitoring tab.

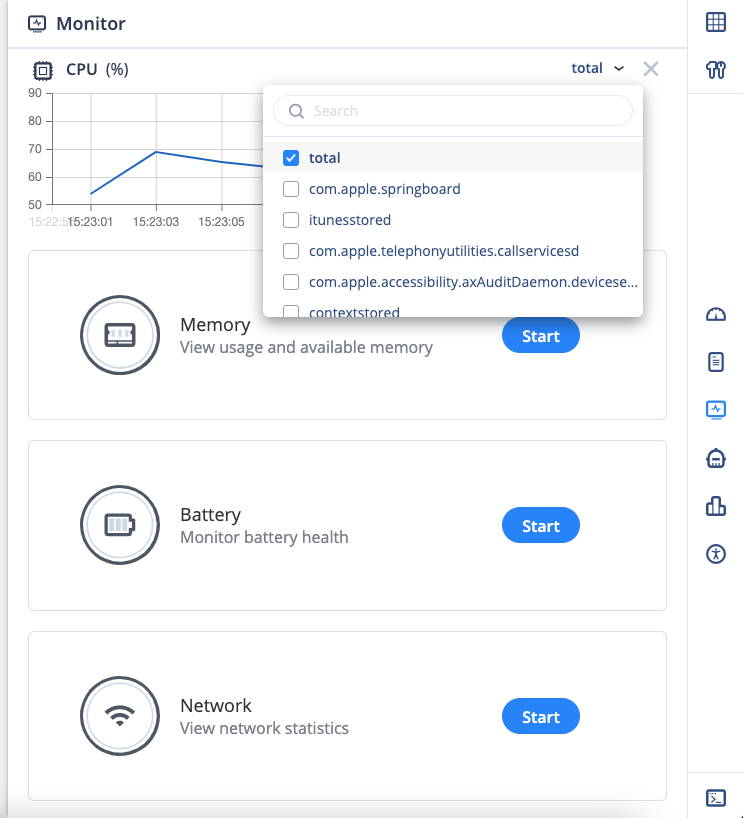
The Monitor panel shows these charts:
- CPU - Percent CPU usage of the total system and each of the processes.
- Memory - Megabytes of memory usage of the total system and each of the processes.
- Battery - Percent battery usage of the total system and each of the processes.
- Network - See Mobile Studio - Simulating Different Network Conditions.
The charts show the information in real time by periodically taking samples from the device.
Hovering over the charts shows for each sample in the chart a tooltip with the exact time stamp and value of the sample.
By default, each chart shows only the graph for the total system.
To select the processes for which to display monitoring information:
-
On the desired chart, click total.

-
Select each process to see the monitoring information for.
-
Click outside the selection list. The monitoring charts show a graph per each process selected.
