Issue Trend Report
This article explains how to use the Issue Trend report in Agility.
Overview
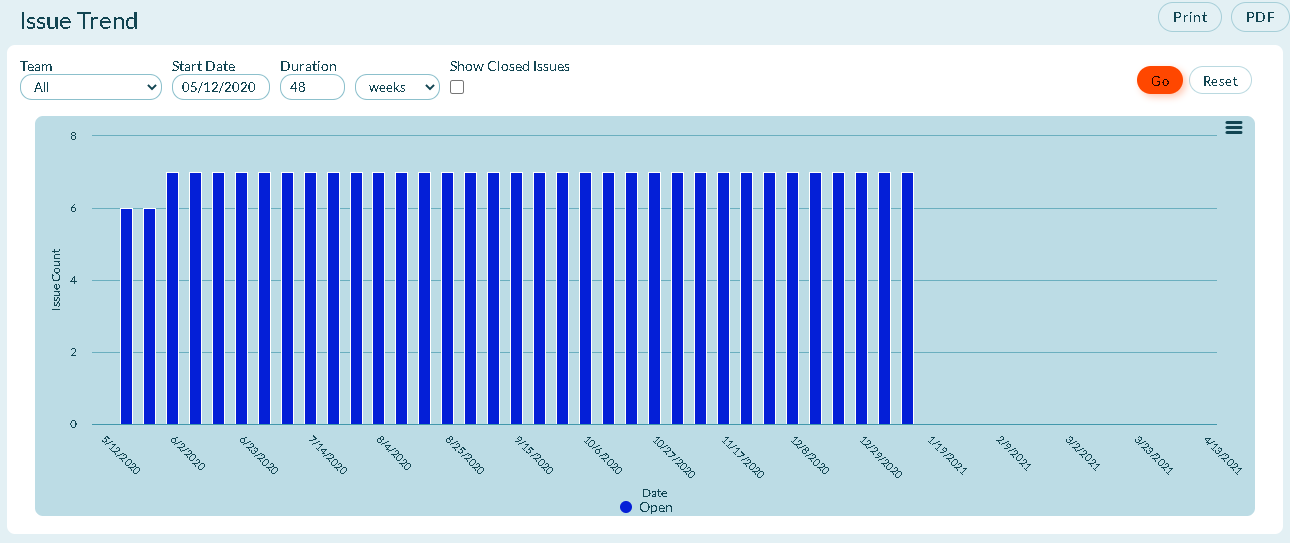
The Issue Trend report shows all open and closed Issues in a project over a specific period of time.
Use this report to track the number of existing issues and to ensure that they are being resolved and not growing too quickly.
Accessing This Report
- Click the hamburger menu
 > Reports > All Reports.
 - In the Testing or Quality Reports section, click Issue Trend Report.
Report Filters or Parameters
- Team: Shows Team-specific data for the project or program. The default value is "All" or "Blank".
Show Closed Items:
Select this check box to show closed items within the report grid.
-
Start Date: The first date the report begins calculating data.
-
- For project-based reports, the default start date is the project start date.
- For sprint or iteration-based reports, the default start date is the sprint or iteration start date.
- For member-based reports, the default start date is 13 weeks prior to the current date.
- If the start date is set to the current date or later, no data displays.
-
Duration: The number of days, weeks, or months to display.
-
- For project-based reports, the default duration is the number of weeks from the project's start date to today.
- For sprint or iteration-based reports, the default duration is the number of days in the sprint or iteration.
- For member-based reports, the default duration is 13 weeks.
- The report ends at the current date, so if the selected start date and duration extend past the current date, no data displays after the current date.
Prerequisites
- All Digital.ai Agility trend reports require at least two data points. If not enough data is available, the report may be blank. Depending on the duration you select in the filters, at least one complete period of data must be available to draw a trend line. When selecting days, this means that the minimum duration is actually 2 days, which will include 2 data points.
- Your Show Weekend report settings may affect how much data is selected. For example, if you choose two days as duration and one day is a Saturday or Sunday, and you have elected to not Show Weekends, then you may not have sufficient data to show a trend.
Technical Details
- Each bar represents the number of open (blue) and closed (red) issues for the selected project, sprint, team, etc.
You can use the Issue Quicklist report to correlate and cross-check the data displayed in this report.
Additional Options
- Printing a report
- Saving a report to PDF