Integrate Dynatrace with Digital.ai Release
The Digital.ai Release Dynatrace plugin enables seamless integration between your release pipelines and Dynatrace monitoring. This integration allows you to incorporate real-time application health checks into your automated release processes, trigger monitor executions, and make data-driven decisions based on monitoring results—all without leaving your pipeline environment.
Overview of Dynatrace Integration
The Dynatrace integration offers powerful monitoring capabilities that enhance your release pipeline's effectiveness and reliability. Here's what you can achieve with this integration:
Features of the Dynatrace Integration
-
Trigger Monitor Executions On Demand: Run Dynatrace monitors (browser or standard) directly from a release pipeline, for a specific location or across all configured locations.
-
Retrieve Latest Execution Results: Fetch the most recent execution data from Dynatrace, with the flexibility to collect results from specific or all monitor locations.
-
Access Essential Monitoring Data: Get focused monitoring information such as status and monitor ID, optimized for use in alerts and automation workflows.
Prerequisites
Before setting up the Dynatrace integration, ensure you have the following:
- An active Dynatrace subscription
- Digital.ai Release 25.1 or later
- The Dynatrace plugin installed via the Plugin Manager
Setting Up Dynatrace Integration
Follow these steps to establish a connection between your Dynatrace server and Digital.ai Release.
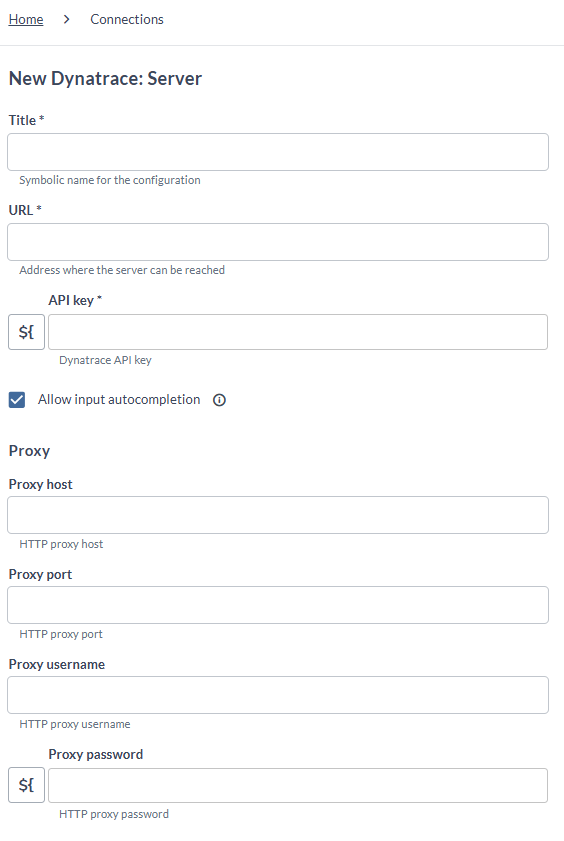
Configure the Dynatrace Server Connection
- Log in to Digital.ai Release
- Navigate to CONFIGURATION > Connections in the navigation pane
- Search for Dynatrace: Server and click the
+button - Complete the configuration form:
- Enter a descriptive name in the Title field
- Specify the server address in the URL field
- Provide your Dynatrace API token in the API key field
- (Optional) Enable Allow input autocompletion if you want the input fields to support lookup suggestions
- If required, enter the proxy details.
- Click Test to verify the connection.
- Click Save to store the configuration.
After setting up the connection, you'll have access to the following Dynatrace tasks when creating templates or releases:
- Dynatrace: Create Synthetic Monitor
- Dynatrace: Update Monitor Settings
- Dynatrace: Get Monitor Executions
- Dynatrace: Trigger On-Demand Executions
Working with Dynatrace Monitors
The integration provides several tasks for managing and utilizing Dynatrace monitors in your release pipeline.
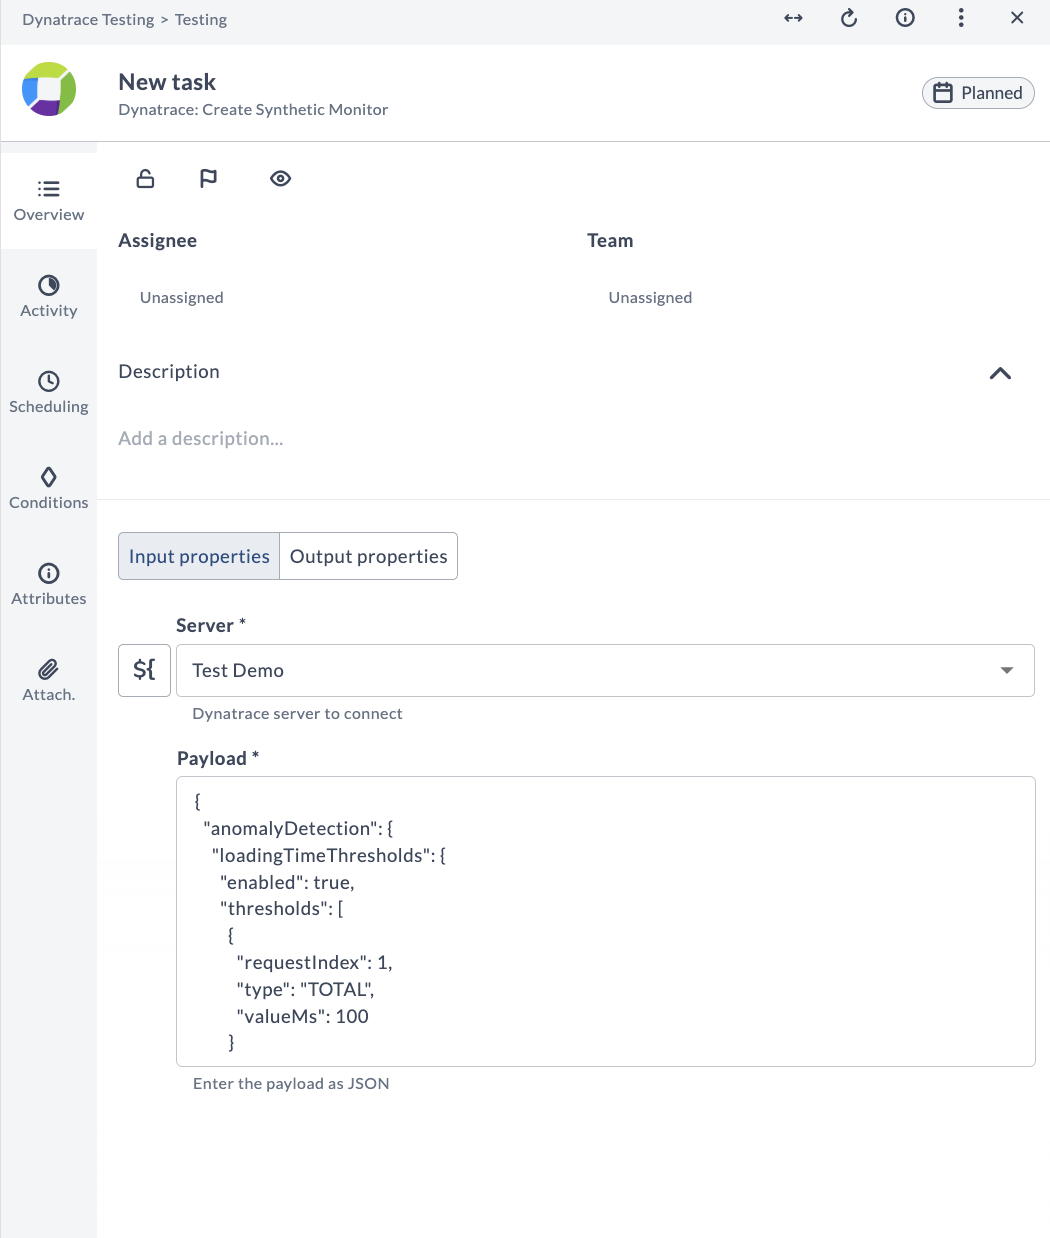
Create Synthetic Monitor
Follow these steps to create a new synthetic monitor in Dynatrace:
- In your template/release, click Add task and search for Dynatrace
- Select Create Synthetic Monitors and click Add
- Configure the new task:
- Choose the server from the drop-down list
- Input your monitor configuration as JSON in the Payload field
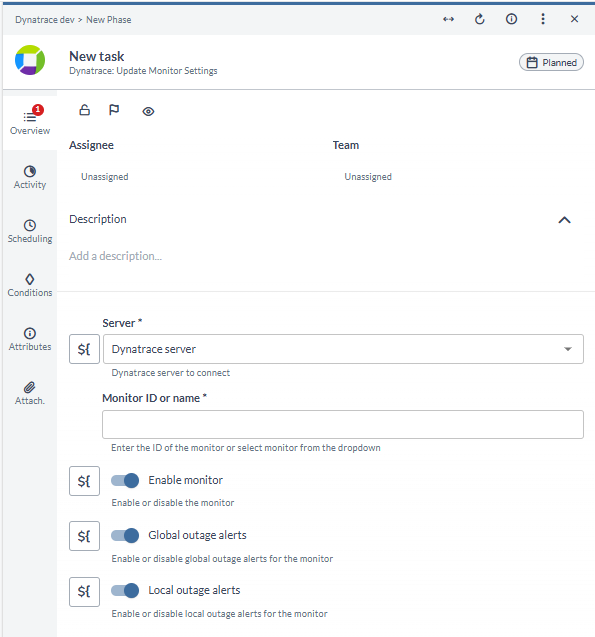
Update Monitor Settings
Use the Update Monitor Settings task to enable or disable a monitor and configure outage alerts.
- Click Add task and search for Dynatrace
- Select Update Monitor Settings and click Add
- Configure the task parameters:
- Server – Select the Dynatrace server connection from the drop-down list
- Monitor ID or name – Enter the ID of the monitor or select the monitor from the list
- Enable monitor – Toggle to enable or disable the monitor
- Global outage alerts – Toggle to enable or disable global outage alerts for the monitor
- Local outage alerts – Toggle to enable or disable local outage alerts for the monitor
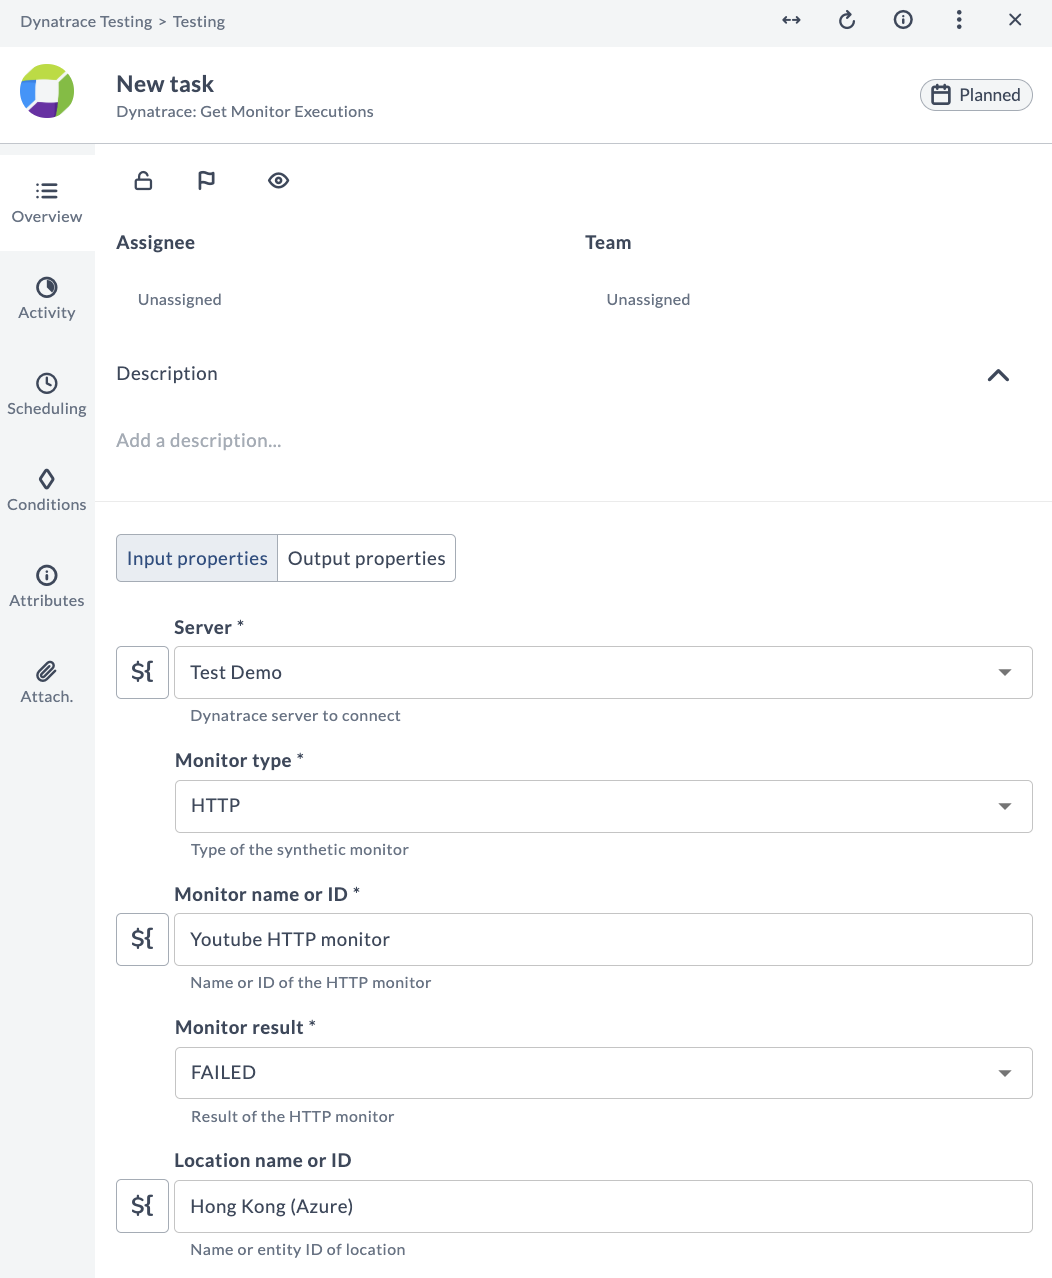
Get Monitor Executions
To fetch the latest execution results for a specific monitor:
- Click Add task and search for Dynatrace
- Select Get Monitor Executions and click Add
- Configure the task settings:
- Select the server from the drop-down list
- Choose the Monitor type
- Enter the monitor name or ID
- Select the desired result filter: SUCCESS or FAILED
- Optionally, specify a location name or entity ID
If no location is specified, the plugin will retrieve results from all locations associated with the monitor.
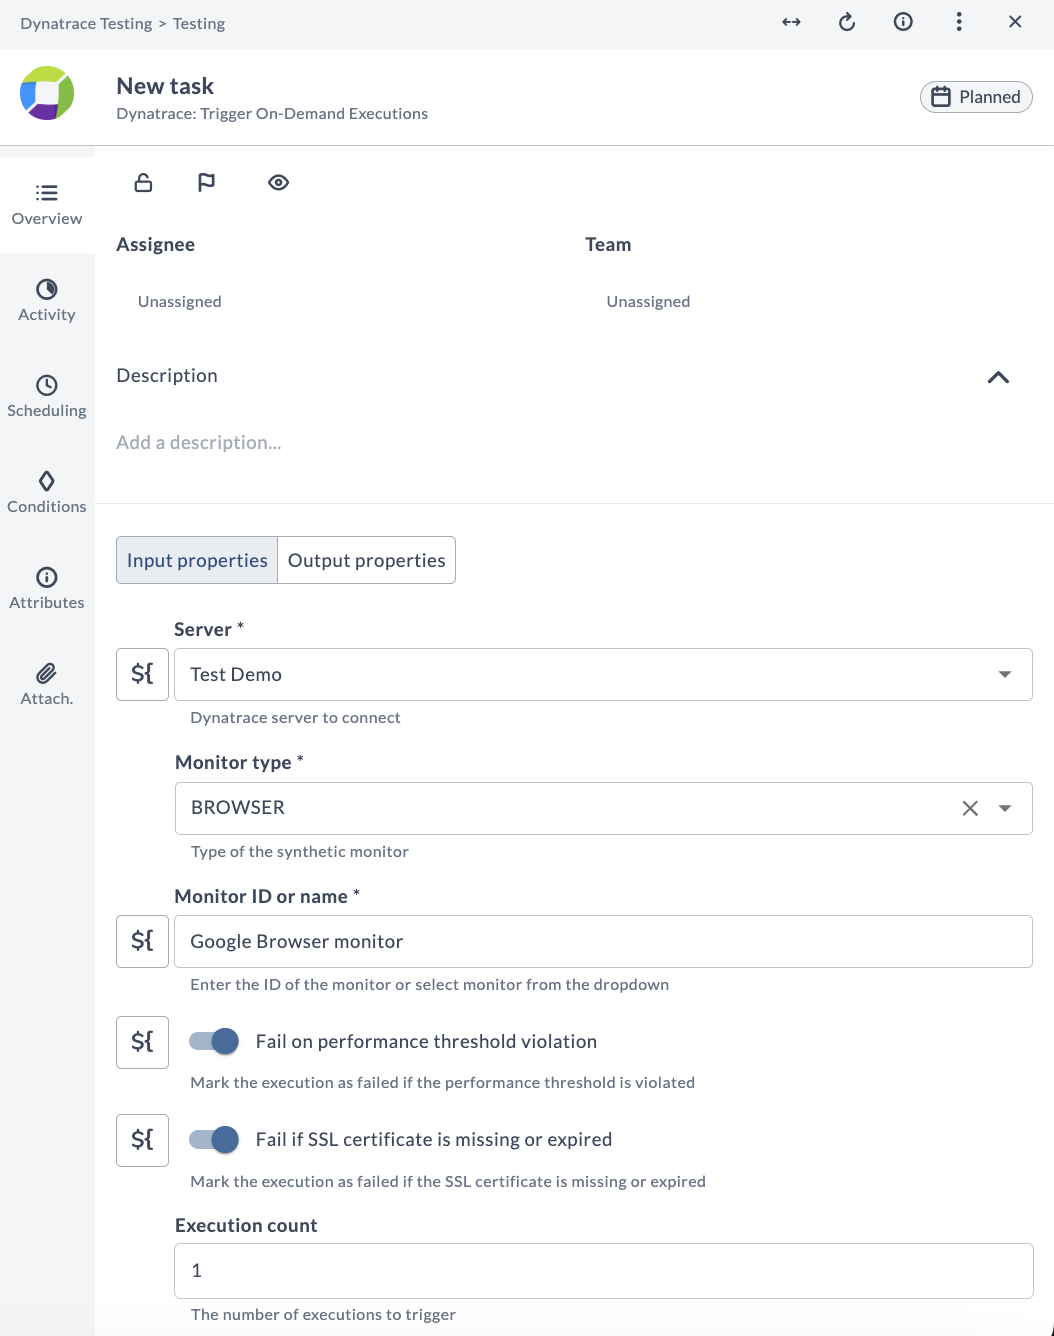
Trigger On-Demand Executions
To manually trigger monitor executions:
- Click Add task and search for Dynatrace
- Select Trigger On-Demand Executions and click Add
- Configure the execution settings:
- Select the server from the drop-down list
- Choose the Monitor type: BROWSER or HTTP
- Enter the monitor name or ID
- Configure execution flags:
- Fail on performance threshold violation (default: enabled)
- Fail if SSL certificate is missing or expired (default: enabled)
- Wait for completion (default: enabled)
- Specify the number of executions in the Execution count field
- Optionally, select a specific location for the trigger
If no location is selected, the execution will run from all assigned locations.