DevOps Research and Assessment (DORA) Dashboard
DevOps Research and Assessment as a dashboard helps you analyze details to streamline or improve your DevOps process using key DORA metrics such as Deployment frequency, Lead time for change, Mean time to restore, and Change failure rate. DORA metrics have now become the standard for gauging the efficacy of software development teams and can provide crucial insights into areas for growth.
As a DevOps manager, you can use this dashboard to understand the following scenarios:
- Identify bottlenecks, need for longer testing time, and identify team's velocity to deliver.
- Identify the efficiency of the process, code complexity, and how quickly a team responds to needs and fixes.
- Identify team's capabilities and understand the causes for deployment failure.
Note: This dashboard currently supports the Digital.ai Release, Digital.ai Deploy, and ServiceNow source system.
The DORA dashboard is built using the dora_common_filter_details, dora_deployment_analysis, dora_lead_time_analysis, dora_industry_standard_grid, dora_change_request_analysis, dora_incident_analysis, and release_last_refresh_datetime datasets.
The DORA dashboard consists of the following sections:
Global Filters
Note: Data is expected to be stored in the release folder structure and analyzed across the organization, team, and application. Release without an associated folder is dropped and not considered for analysis.
- Select Organization
:
- Digital.ai Release Source: The parent folder of the leaf folder associated with a release in a hierarchical file system.
- ServiceNow Source: A unit or division within an enterprise, such as a department or a business unit.
- Select Team
:
- Digital.ai Release Source: The leaf folder (folder containing no subfolder within a hierarchical file system) associated with a release.
- ServiceNow Source: Group of individuals who work together collaboratively to achieve a task or resolve an incident.
- Select Applications
: A software program designed to perform specific functions or tasks.
KPI
- Deployment Frequency (daily)/Deployment Frequency by Occurrence: Displays the number of times or distinct days the software is provided in production for the last 30 days by default. Additionally, this KPI provides the deployment frequency/deployment frequency by occurrence for the last to last 30 days and the percentage increase or decrease in deployment frequency/deployment frequency by occurrence as compared to the previous 30 days.
- Lead Time for Change/Cycle Time/Lead Time (days): Displays the mean time consumed to make code changes on request for the last 30 days by default. Additionally, this KPI provides the lead time for change/cycle time/lead time for the last to last 30 days and the percentage increase or decrease in lead time for change/cycle time/lead time as compared to the previous 30 days.
- Mean Time to Restore (hours): Displays the mean time consumed to diagnose and rectify a bug or an incident for the last 30 days. Additionally, this KPI provides the mean time for the last to last 30 days and the percentage increase or decrease in mean time as compared to the previous 30 days.
- Change Failure Rate (%): Displays the rate of code change failure as a factor of all code changes for the last 30 days. Additionally, this KPI provides the failure rate for the last to last 30 days and the rate of increase or decrease in change failure rate as compared to the previous 30 days.
Panel Filters
Panel filters are used to filter selected panels or visualization on the dashboard.
-
From: The from filter allows you to include the beginning or starting date and time to analyze
-
To: The to filter allows you to include the end or closing date and time to analyze
-
Day: The day filter allows you to view data for a specific day
-
Week: The week filter allows you to view data aggregated by week
-
Month: The month filter allows you to view data aggregated by month
Deployment Frequency (daily)/Deployment Frequency by Occurrence
This panel displays a bar graph of the DORA metric and helps you analyze how many times or distinct days an organization successfully releases software into production.
- Deployment Frequency (daily): Tracks the number of times a new software releases or updates are deployed to production. For example, if a team deployed code 10 times in a month with 31 days, the deployment frequency would be 10/31 = 0.32 deployments per day.
- Deployment Frequency by Occurrence: Tracks the number of distinct days within a given period where at least one deployment to production took place. For example, if deployments occurred on May 1, 3, 5, 10, and 15, the deployment frequency by occurrence for May would be 5.
A higher deployment frequency indicates the team is releasing updates more frequently, reflecting the value of delivery to end users. You can hover over a bar to view details such as deployment date/week/month and deployment frequency/deployment frequency by occurrence. The panel also provides a reference line to compare or measure against the data values displayed in the graph and a trend line to represent the direction of your data.
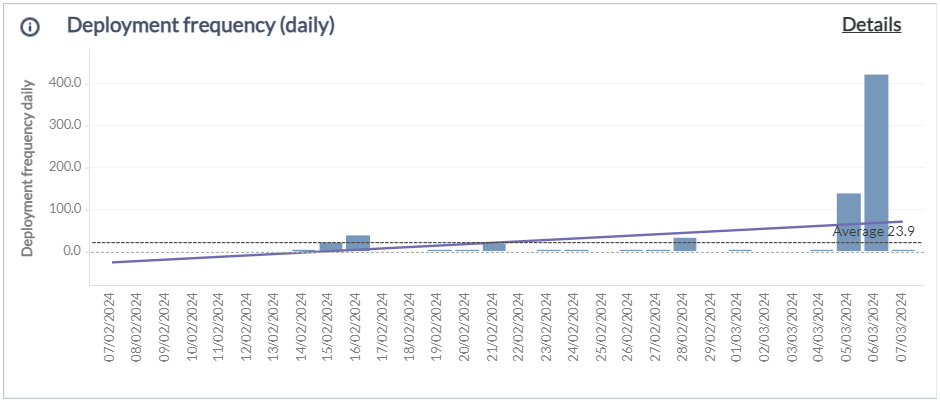
In order to perform a detailed analysis of the deployment frequency, click Details.
Deployment Frequency/Deployment Frequency by Occurrence
This panel displays a bubble graph to indicate the deployment frequency/deployment frequency by occurrence and deployment failure rate for each organization, team, or application. Each bubble corresponds to an organization, team, or application and the size of bubble is associated to its deployment failure rate. You can hover over a bubble to view the details of organization/team/application, deployment frequency, and deployment failure rate.
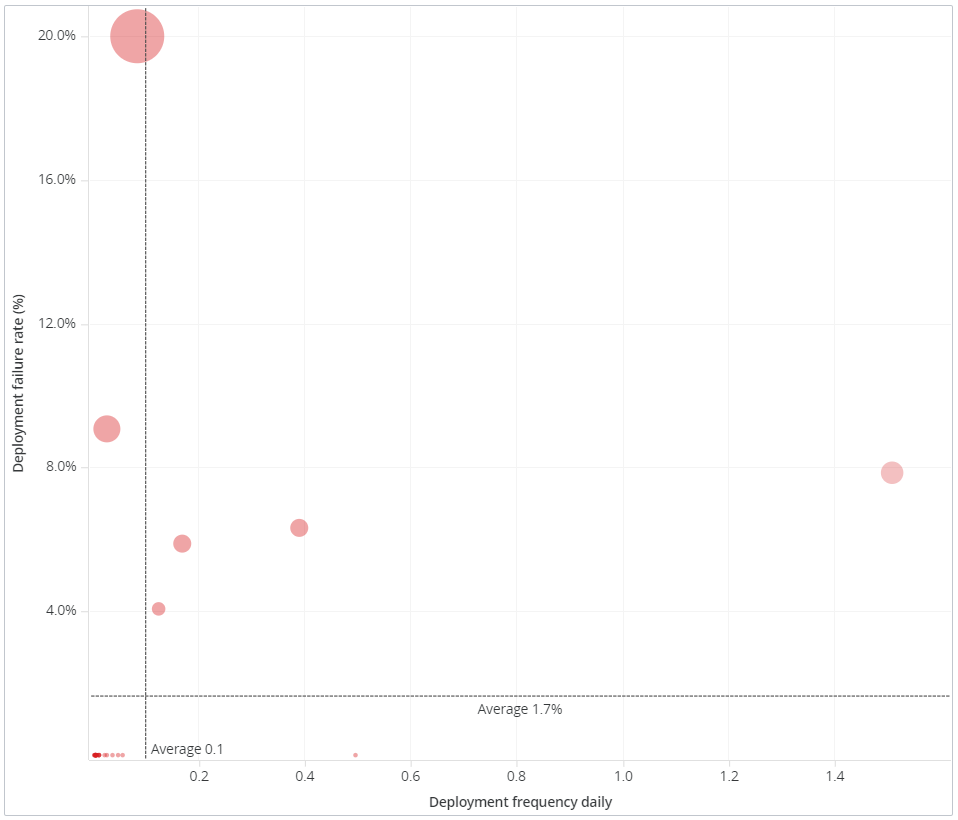
Selection of an organization, team, or application from this panel drives the data of the By Day, By Week, or By Month and Details panel.
By Day/By Week/By Month
This panel displays a dual y-axis graph, combining a vertical bar graph that displays the trend in the deployment frequency/deployment frequency by occurrence and a line graph that displays the trend in the deployment failure rate.
Details
This panel provides detailed information of Deployments such as deployment name, source link, deployment Id, start and completed date time, status, application name and version, environment name, and deployment type.
Lead Time for Change/Cycle Time/Lead Time (days)
According to the common definition, this metric represents the total time from the initiation of a change to its completion. It is measured based on the context and industry requirements and is generally classified into three categories: Lead Time for Change, Cycle Time, and Lead Time
- Lead Time for Change: Measures the total time from when the development team makes a commit until the change is deployed in production.
- Cycle Time: Measures the time taken from when a development team starts working on a change until it is deployed in production.
- Lead Time: Measures the total time from when a customer or user requests a change until it is deployed in production.
This panel displays an area graph of the DORA metric and helps you analyze the time it takes for a code change to be developed, tested, and deployed to production for a change requested. A shorter lead time indicates the team is efficiently moving code change through the development pipeline. You can hover over the area to view details such as Deployment date and Lead time for change/Cycle Time/Lead Time. The panel also provides a reference line to compare and a trend line to represent the direction of your data.
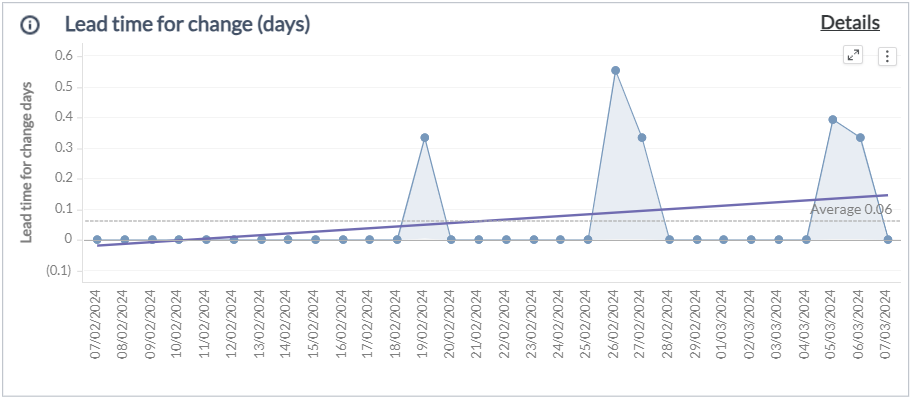
In order to perform a detailed analysis of the lead time for change, click Details.
Lead Time for Change/Cycle Time/Lead Time
This panel displays a bubble graph to indicate the lead time for change/cycle time/lead time and number of deployments for each organization, team, or application. Each bubble corresponds to an organization, team, or application and the size of bubble associated to its count of deployments. You can hover over a bubble to view the details of organization, team, or application, lead time for change/cycle time/lead time and total deployments.
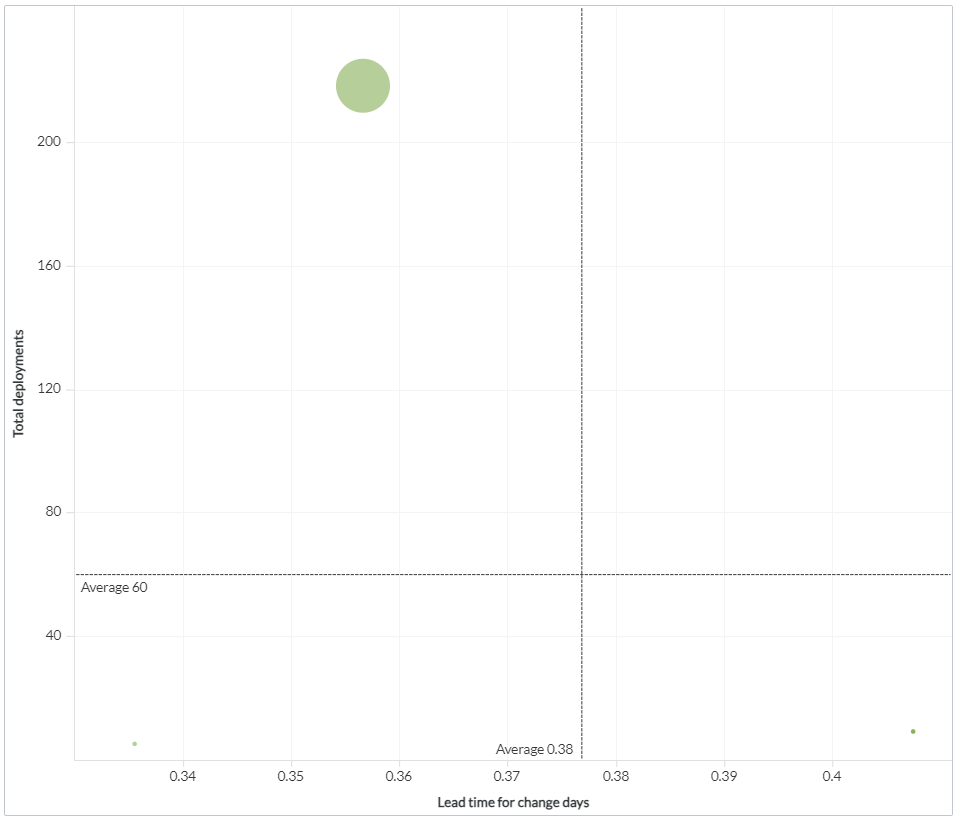
Selection of an organization, team, or application from this panel drives the data of the By Day, By Week, or By Month and Details panel.
By Day/By Week/By Month
This panel displays a dual y-axis graph, combining a vertical bar graph that displays the trend in the number of deployments and a line graph that displays the trend in the lead time for change/cycle time/lead time.
Details
This panel provides detailed information on Changes, including common details such as release name, release description, source link, and deployment name. It also includes specific information like change number, change start date, change end date, and lead time for change in days under the Lead time for change category. Additionally, it covers agile task name, agile task start date, deployment end date, and cycle time in days for the Cycle time category. Furthermore, it includes commit task name, commit start date, deployment end date, and lead time in days for the Lead time category.
Mean Time to Recover (hours)
This panel displays an area graph of the DORA metric and helps you analyze the time consumed to diagnose and rectify a bug or an incident. A lower MTTR implies that the team is proficient at identifying and addressing issues promptly, ensuring minimal disruptions. You can hover over the area to view details such as Deployment date, and Mean time to recover. The panel also provides a reference line to compare and a trend line to represent the direction of mean time.
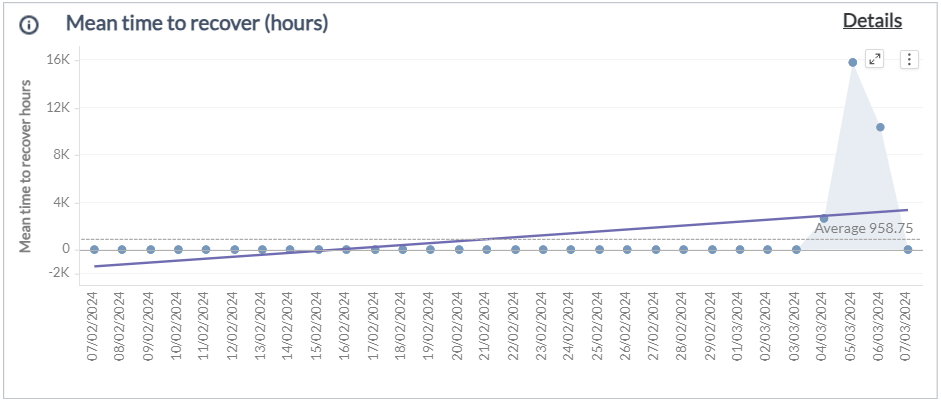
In order to perform a detailed analysis of the mean time to recover, click Details.
Mean Time to Recover
This panel displays a bubble graph to indicate the average mean time to recover and number of major incidents for each organization, team, or application. Each bubble corresponds to an organization, team, or application and the size of bubble associated to its count of major incidents. You can hover over a bubble to view the details of organization, team, or application, average mean time to recover, and total number of major incidents.
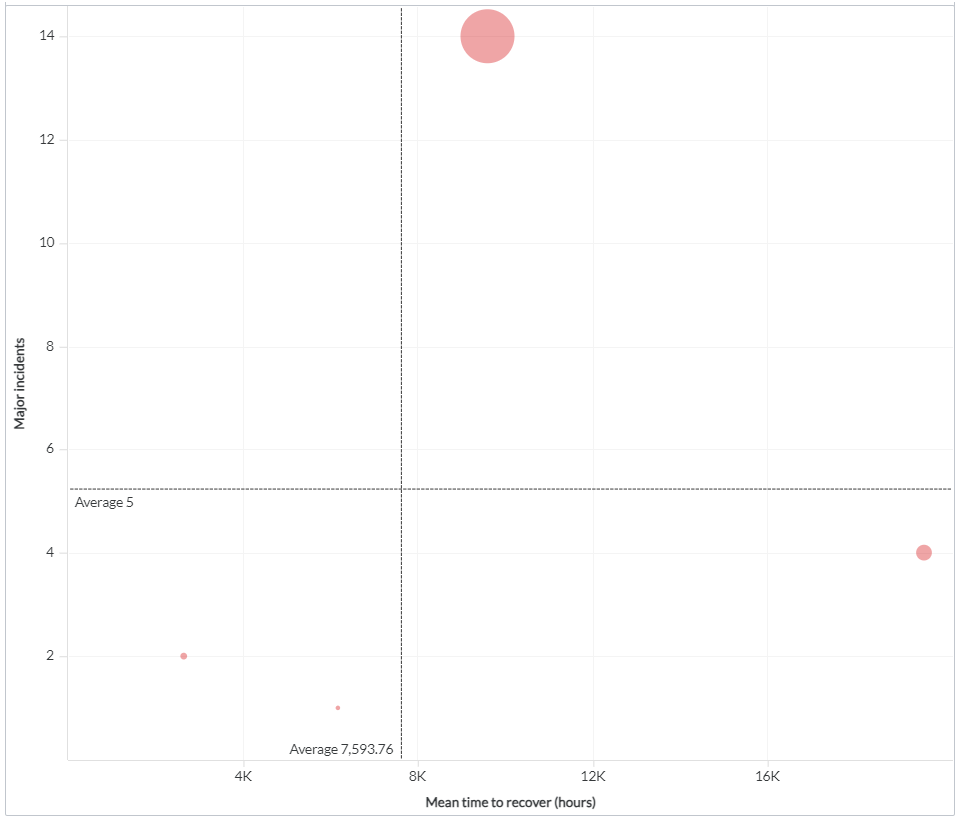
Selection of an organization, team, or application from this panel drives the data of the By Day, By Week, or By Month and Details panel.
By Day/By Week/By Month
This panel displays a dual y-axis graph, combining a vertical bar graph that displays the trend in the number of resolved major incidents and a line graph that displays the trend in the average mean time to recover.
Details
This panel provides detailed information of Incidents such as incident number, source link, description, opened and resolved datetime, close code, caused by, and mean time to recover.
Change Failure Rate (%)
This panel displays a bar graph of the DORA metric and helps you analyze the rate of code change failure. A lower change failure rate signifies that the organization has robust testing practices and a stable deployment process. You can hover over a bar to view details such as Deployment date and Change failure rate. The panel also provides a reference line to compare and a trend line to represent the direction of change failure rate.
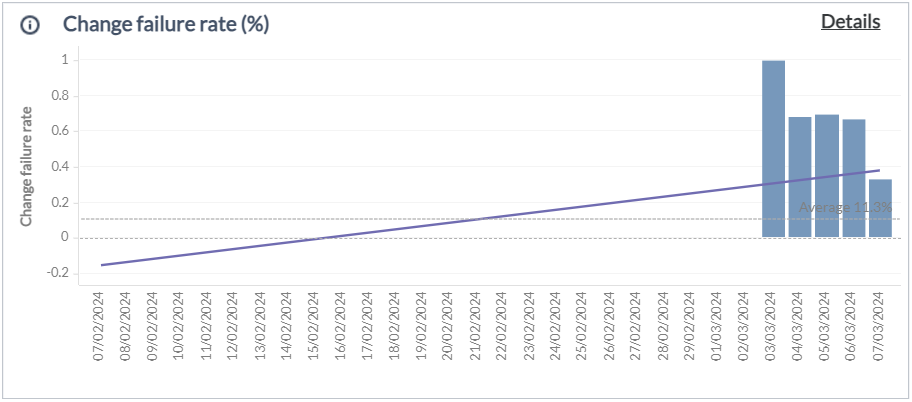
In order to perform a detailed analysis of the change failure rate percentage, click Details.
Change Failure
This panel displays a bubble graph to indicate the change failure rate and number of closed changes for each organization, team, or application. Each bubble corresponds to an organization, team, or application and the size of bubble associated to its count of closed changes. You can hover over a bubble to view the details of organization, team, or application, change failure rate, and total number of closed changes.
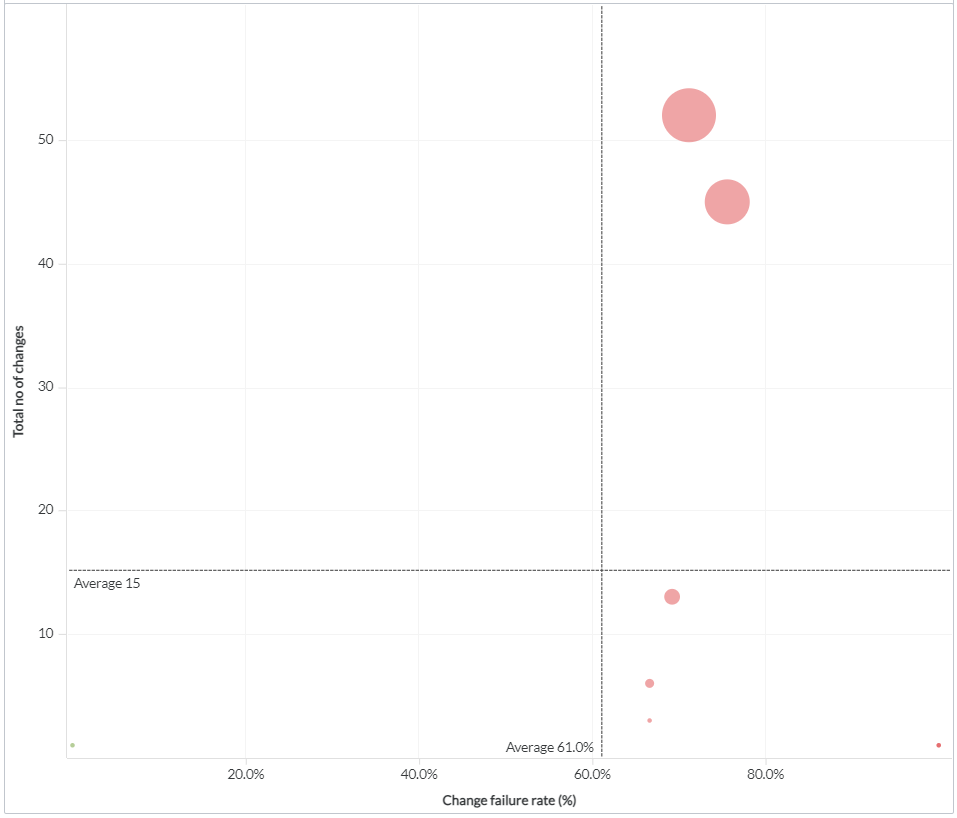
Selection of an organization, team, or application from this panel drives the data of the By Day, By Week, or By Month and Details panel.
By Month
This panel displays a dual y-axis graph, combining a vertical bar graph that displays the trend in the number of closed changes and a line graph that displays the trend in the change failure rate.
Details
This panel provides detailed information of Changes such as change number, source link, description, opened and closed datetime, linked to release flag, and release ID.
Comparison to Industry
Displays the industry standard thresholds set by the DORA team for comparison and performance enhancements. For any change in DORA standards, refer to the Configuring DORA Industry Standards section to edit thresholds.
Limitation/Assumption
Following are a few considerations made across each metric in order to consolidate data from different sources and display visualizations:
-
Deployment Frequency/Deployment Frequency by Occurrence:
- Automatic deployments of Release, Deploy, ArgoCd, Ansible, and Manual deployments are considered.
- The deployment start date is considered for reporting.
- In the release source, the deployment status appears as the status of the release task.
- The successful flag is used for both deployment frequency and deployment failure rate metrics.
-
Lead Time for Change/Cycle Time/Lead Time:
- Deployment completed date and time are considered for reporting.
-
Mean Time to Recover:
- Only ServiceNow data is considered.
- Critical and high priority incidents are considered major incidents.
-
Change Failure Rate %:
- Only ServiceNow data is considered.
Components used in this dashboard
This section lists all the attributes and metrics used to build the reports in this dashboard.
Attributes
| Attribute Name | Description |
|---|---|
| Application | Name of the software program designed to perform a specific task |
| Application version | Unique identifier of the application |
| Calendar Date | Gregorian calendar date displayed in the format 'M/D/YYYY' |
| Calendar Month | Gregorian calendar month displayed in the format 'Mon YYYY' |
| Caused by Change | Change request that caused the incident |
| Change End date | The completion date and time of the change request |
| Change Request Description | Description of a task created requesting a change |
| Change Request Number | Unique identifier of a task created to implement a change in a process or product |
| Change Request Source URL | The source link to view the change request |
| Change Start date | The creation date and time of the change request |
| Deployment Status | Current status of the deployment |
| Deployment End Date | The completion date and time of the deployment |
| Deployment ID | Unique identifier for the deployment |
| Deployment Name | Label or identifier assigned to a specific deployment process or event |
| Deployment Source URL | The link to view the deployment in the Digital.ai Deploy source |
| Deployment Start Date | Date on which the package was initially deployed |
| Deployment type | Type of deployment that is being carried out |
| Environment | Name of the environment under the release definition in which the deployment was carried out |
| Incident Close Code | Field to capture how the Incident was closed |
| Incident Description | Description of an unplanned interruption |
| Incident End date | The completion date and time of the incident |
| Incident number | Unique identifier of the Incident |
| Incident Source URL | The link to view the incident in the ServiceNow source |
| Incident Start Change | The date and time of implementing changes to an incident report |
| Lagging 30 days period flag | Flag to indicate if an event or count has occurred in the past 30 days |
| Organization | Name of the structured group of people with a common goal or purpose |
| Performance level | Discrete values used to identify the benchmarks |
| Release | Name of the working software provided to an end user |
| Release Description | The description of the release |
| Release ID | Unique ID of the Release |
| Release Source URL | The link to view the release in the Digital.ai Release source |
Metrics
| Metric Name | Description |
|---|---|
| Change failure rate | Percentage of change in Change Requests that have failed |
| Cycle time (Days) | The time taken in days from when a development team starts working on a change until it is deployed in production |
| Deployment Failure rate | Percentage of number of deployments which are unsuccessful |
| Deployment Frequency | Average number of successful software released to production |
| Lead time (Days) | The total time in days from when a customer or user requests a change until it is deployed in production |
| Lead time for change (Days) | Total time in days from when the development team makes a commit until the change is deployed in production |
| Major Incidents | Incidents reported as Critical or High priority |
| Mean time to recover (hours) | The elapsed time between the Incident creation and resolution. The elapsed time is measured as the total time |
| Total deployments | Total count of Deployments attempted for a particular release |
| Total no of change request | Total count of requests for a change in a process or product that is necessary |