Forecast Increment Completion
Increment Forecasting projects completion dates based on velocity calculations from historical data. Use optimistic, pessimistic, and average forecasts to assess delivery timelines and perform what-if scenarios by adjusting key inputs.
Permission requirement: Viewing increment forecasts requires read access to the project, increment, teams, and historical sprint data. Performing what-if analysis does not modify data and requires only read permissions.
Who Forecasts Increment Completion
Increment forecasting supports data-driven planning decisions:
- Product Owners use velocity-based projections to assess delivery risk by comparing forecast dates to planned end dates and identify capacity gaps.
- Scrum Masters perform what-if analysis to test different planning scenarios, adjusting velocity assumptions based on team composition changes or scope adjustments.
- Portfolio Managers view team-specific forecasts to understand delivery timelines across multiple teams and identify which teams need support or descoping.
- Program Managers analyze optimistic, pessimistic, and average end dates to communicate realistic delivery expectations to stakeholders and executives.
Key Capabilities
Increment Forecasting provides:
- Velocity-based projections: Calculate completion dates using historical velocity data
- Three forecast scenarios: View optimistic, pessimistic, and average end dates
- What-if analysis: Override inputs to test different planning assumptions
- Aggregation options: Forecast by total estimate or work item count
- Team-specific forecasts: View forecasts for individual teams or all teams
Generate a Forecast
To generate an increment forecast:
- Click the hamburger menu
 > Increment > Increment Forecasting.
 - Configure report filters (see below for details).
- Click Go.
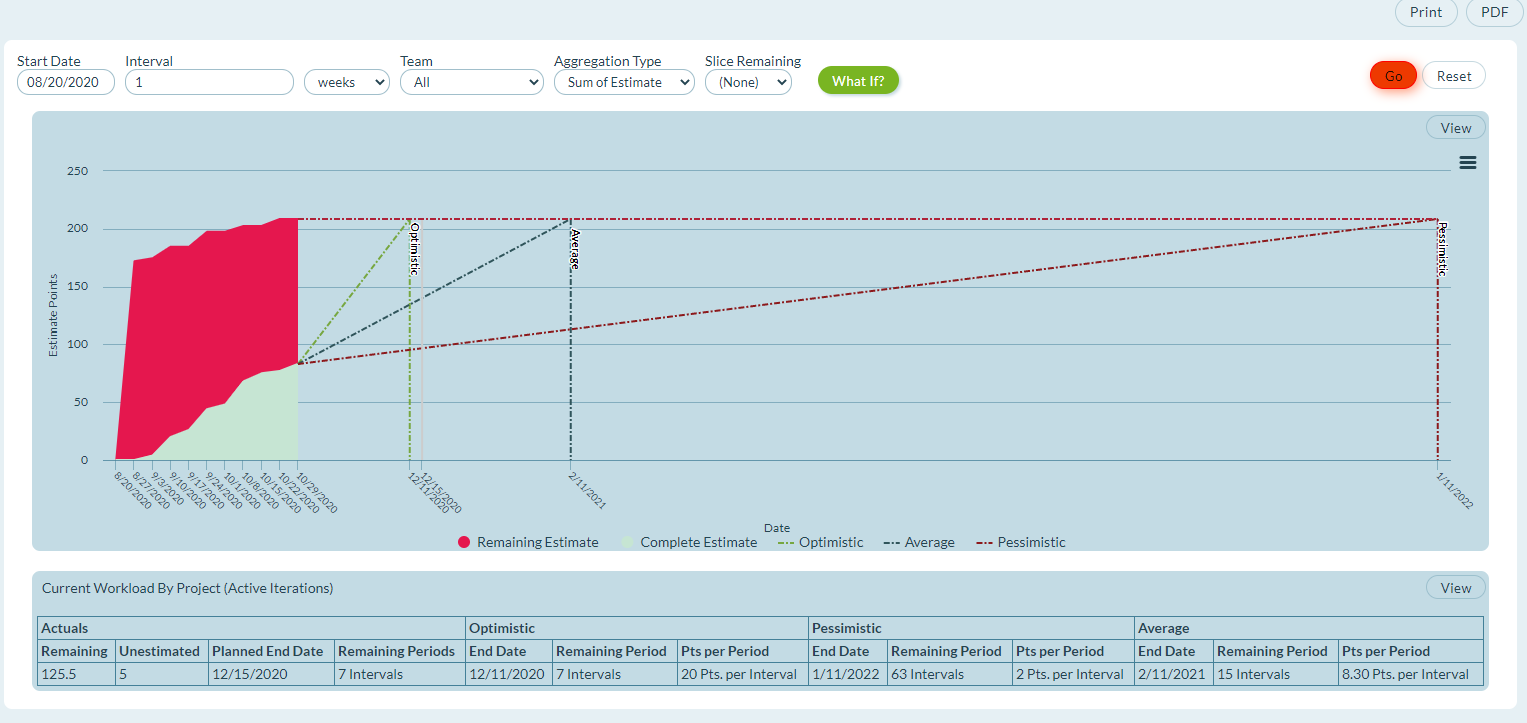
Result: The chart displays historical data and forecasted completion dates with three velocity scenarios.
Report Filters
Configure these filters to customize your forecast:
| Filter | Description | Default Value |
|---|---|---|
| Start Date | First date for calculating historical data | Project/sprint start date, or 13 weeks prior (for member-based reports) |
| Interval | Frequency of data points | - |
| Team | Team-specific data for the project or program | All |
| Aggregation Type | How data is aggregated: - Total Estimate: Sum of Estimate values - Workitem Count: Count of work items | - |
| Slice Remaining | Segments chart by work item attribute: None, Priority, or Type | None |
Note: If the start date is set to the current date or later, no data displays.
Interpret the Forecast
The forecast chart shows:
- Historical data: Completed and remaining work over past intervals
- Three forecast lines: Optimistic, pessimistic, and average completion dates
- End date indicator: Planned end date of the selected project for comparison
- Unestimated work: Number of work items without estimates (when displaying by Estimate)
Forecast Calculations
The algorithm works as follows:
- Retrieve historical data: Gather remaining and completed backlog items based on start date, interval, team, and aggregation settings
- Analyze slope changes: Calculate the largest slope change, smallest non-zero slope change, and average of all slope values (including intervals with no change)
- Project completion dates:
- Optimistic: Uses the largest slope value (fastest velocity)
- Pessimistic: Uses the smallest non-zero slope value (slowest velocity)
- Average: Uses the average slope value (typical velocity)
- Calculate periods: Divide remaining work by slope value to determine additional periods needed
- Determine end date: Add additional periods to the last interval
Note: Because zero-velocity periods are included in the average calculation, the pessimistic end date may precede the average end date.
Forecast Line Scenarios
You may see fewer than three forecast lines when:
- A velocity value is specified in the What-If box
- Insufficient historical data exists to calculate all three scenarios
Perform What-If Analysis
Test different planning scenarios by overriding default values:
- Click What-If to display scenario fields.
- Adjust values in the fields below.
- Click Go to regenerate the forecast.
Result: The chart updates with your custom scenario values.
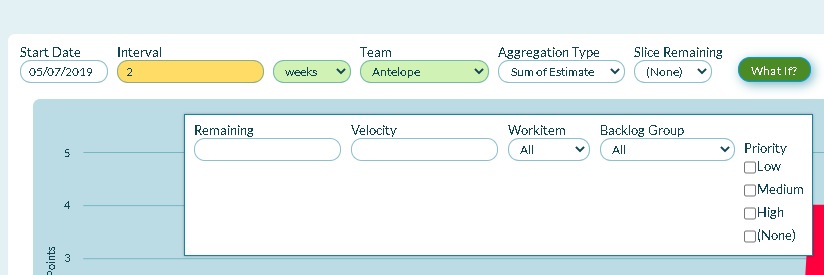
What-If Fields
| Field | Description | Default |
|---|---|---|
| Remaining | Override the remaining work value | Uses actual value from historical query |
| Velocity | Set delivery velocity (results in only one forecasted end date) | Calculates velocity based on slope values |
| Workitem | Filter remaining work calculation by work item type: All, Story, or Defect | All |
| Backlog Group | Show only work items in the selected Backlog Group (includes child groups) | All |
| Priority | Show only work items with selected priorities | None (all priorities) |
Use Forecasts for Planning
Apply forecast insights to:
- Assess delivery risk: Compare forecast dates to planned end dates
- Identify capacity gaps: Determine if additional velocity is needed
- Test scope adjustments: Use what-if analysis to see impact of reducing remaining work
- Set realistic expectations: Share velocity-based projections with stakeholders
- Plan mitigation strategies: Adjust team allocation or scope based on forecasts
Troubleshooting
Why don't I see any forecast lines on the chart?
Forecast lines require sufficient historical data to calculate velocity. If the start date is set to the current date or later, no historical data exists to calculate forecasts. Set the start date to at least 3-4 intervals in the past to provide baseline velocity data. Verify work items have estimate values or count data for the selected aggregation type.
Why does the pessimistic forecast show an earlier date than the average forecast?
This occurs when velocity varied significantly across historical intervals. The average forecast includes zero-velocity periods (intervals with no work completed), which can push the average completion date later than the slowest non-zero velocity period used for the pessimistic forecast. This is mathematically correct but may seem counterintuitive.
How do I account for team size changes in future forecasts?
Use the what-if analysis Velocity field to override the historical velocity calculation with an adjusted value reflecting your new team size. For example, if historical velocity is 40 points per sprint with 5 team members and you're adding 2 members (40% increase), set velocity to approximately 56 points (40 × 1.4) to project completion with the larger team.
Why do I only see one forecast line after entering a What-If velocity?
When you specify a custom velocity value in what-if analysis, the system uses that single value for all calculations instead of calculating optimistic, pessimistic, and average scenarios from historical data. This is intentional: your custom velocity overrides all three forecasts, showing only one projected end date based on your specified assumption.