Understanding the Program Board Layout and Indicators
The Program Board summarizes when features, planned in the selected Program Increment or Release, will be available based on where the associated work items are planned for completion. The Program Board also highlights cross-team dependencies that could impact the completion of those feature. This information allows you to identify and focus on the cross-team communications that matter most. The primary use of this board is to verify your planning sessions before development starts; however because the information presented is based on, and reflects, the current state of work in Digital.ai Agility, the Program Board can also be used to monitor or track the work throughout the program increment or release.
Accessing the Program Board
- Click the hamburger menu
 > Release > Program Board.
 - Select a project or program from the Project Navigator.
Prior to the Fall 2017 release, the selected project or program must have a Start Date, an End Date and a single Schedule. This restriction was removed with the introduction of a Date Based option in the Fall 2017 release.
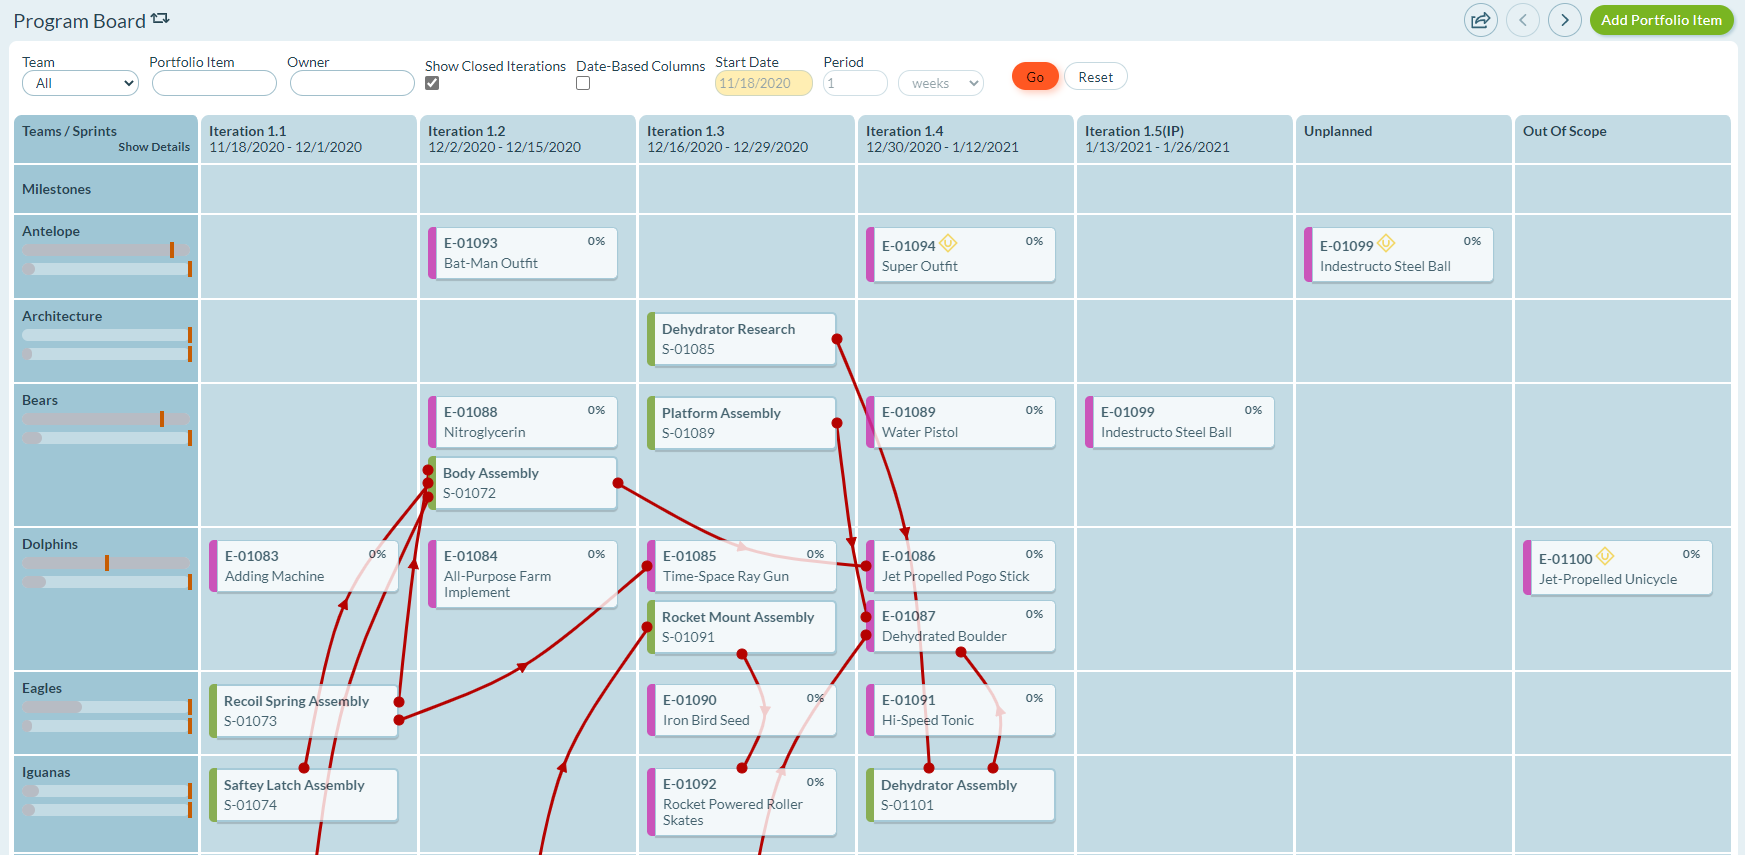
Program Board Layout
The following table describes the Program Board layout.
| Item | Description |
|---|---|
| Rows | Represents the team that owns the project or program work. |
| Columns | When Date Based Columns is cleared: Each column represents a sprint or iteration that has a begin or end dates in the date range defined by the selected Project or Program When the Date Base Columns is selected: Each column represents a date range defined by the Period option. |
| Unplanned column | Shows work that has not yet been planned. - A portfolio item in this column indicates that no stories or backlog items assigned to the team have been planned into a sprint or iteration - An upstream dependency story or backlog item in this column indicates that it has not been planned into a sprint or iteration. |
| Out Of Scope column | Shows work intended to be delivered, but not as part of the selected project or program. - A portfolio item in this column indicates that some of the work in the portfolio item is not in scope. - An upstream dependency backlog item in this column indicates that the required backlog item is not being considered for delivery in the selected project or program. |
Program Board Cards
The following table describes the cards visible on the Program Board.
| Card | Description |
|---|---|
| Portfolio Item Cards | Portfolio Items, regardless of type, in the selected Project or Program that do not have a parent Portfolio Item in the selected Project or Program. These are also referred to as Tracked Portfolio Items. They are the same Portfolio Items you see on the Kanban Board and at the top level on the Portfolio Tree when no filters are applied. If multiple teams are working on the same portfolio item, the card displays on the board multiple times; once for each team delivering work. The Portfolio Item type is indicated by the colored bar on the left side of the card. If a team has planned and unplanned work in a portfolio item, a yellow "U" icon displays. This indicates that the portfolio item may not be delivered in the sprint or iteration where the card appears. Until the portfolio item is delivered, a percent complete indicator displays in the top right corner of the card. This measure is determined by count or total estimate based on your tracking preferences. Progress is indicated with card shading. As work is delivered, the portfolio item card will be shaded darker from left to right. When the Date Based Column option is not selected, Portfolio item cards display in the last sprint or iteration a team has work planned. When the Date Based Column option is selected, Portfolio item cards display in the column containing the end date of the last sprint or iteration where the team has work planned. |
| Upstream Dependency Backlog Items (also known as Provider or Source Backlog Items) | Upstream Dependency Backlog Items are the Backlog Items that must be completed first before the team can complete their work. Upstream Dependency Backlog Items display only when the dependencies are being satisfied by another team. If a single team owns all the dependencies, they do not display on the Program Board. A red line connects Upstream Dependency Backlog Items to the portfolio items they impact. When the Date Based Column option is not selected, Upstream Dependency Backlog Items are displayed in the sprint or iteration where the team planned to complete the work. When the Date Based Column option is not selected, Upstream Dependency Backlog Items are displayed in the column containing the end date of the sprint or iteration where the team planned to complete the work. For more details, refer to The Red Lines Connecting Cards below |
The Red Lines Connecting Cards
Ideally, there are no dependencies and, if when they exist, they are all completed by the same team. However, this is not always the case. When a story or backlog item requires input from another team, the Program Board displays the upstream dependency backlog item (or the source) in the sprint or iteration connected to the portfolio item with a red line. If there are additional upstream dependencies from other teams, those are also visible and connected with a red line.
The red arrow on the dependency line indicates the direction of flow. The arrow always points from the upstream item (Source or Provider) to the downstream item (dependent or consumer) Ideally, you want to see these arrows pointing from right ( -> ) across iteration boundaries. An arrow pointing left (<-), indicates that the upstream dependency (source) has been planned after the downstream dependent (consumer). This is a problem that needs to be addressed. An arrow pointing up or down to another item in the same iteration, indicates that both the upstream dependency and the downstream dependent are being completed in the same iteration. This situation requires that all teams involved need to coordinate even more closely to make sure both items are completed.
Team Capacity Metrics
Team capacity indicators provide insight into how Team commitments compare to their anticipated ability to delivery. There are indicators for both Swag and Estimate and clicking the Show Details link at the top of the column reveals the numbers behind these indicators.
These numbers are calculated using the following factors
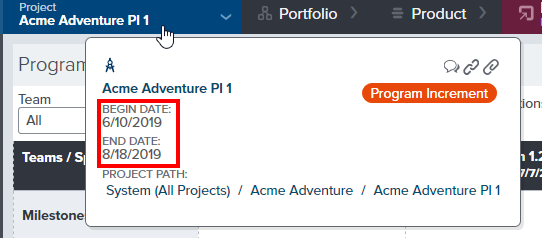
- Project or Planning Level duration. The Begin and End Date for the selected Project or Planning Level is visible when hovering on the Planning Level or when viewing the Planning Level Details page.
- The Teams anticipated capacity to deliver from the Team Details page. The Target Estimate and Target Swag values can be set on the Team Details page
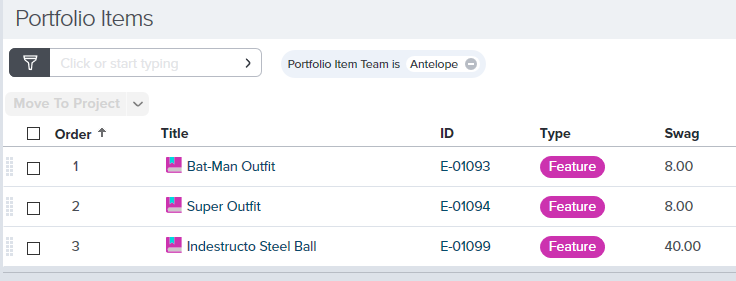
- Total Swag on Portfolio Items associated to the Team. Portfolio Items have a Target Team attribute that allows you to associate the Portfolio Item to a team. You can open each Portfolio Item individually from the Program Board or you can use the Portfolio Tree filtered on Target Team. Make sure the SWAG column is visible.
- Total Estimate on Stories and Defects associated to the Team. Stories and Defects have a Team attribute that allows you to associate the asset to a specific Team. You can view all Stories and Defects associated to the Team on the Backlog page. You will need to filter on Team and make sure the Estimate column is visible.
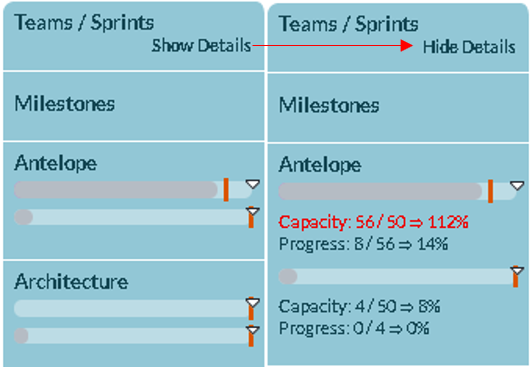
Here's an example for the Antelope team shown in the image above
1. For the selected Planning Level, the begin date is June 10th to August 18th. This represents 10 weeks (rounding up)
2. From the Antelope Team Details page, we have specified that the team can deliver 5 points per week and 5 swag units per week. Therefore in 10 weeks we anticipate that the Antelopes can deliver 50 swag units and 50 points.
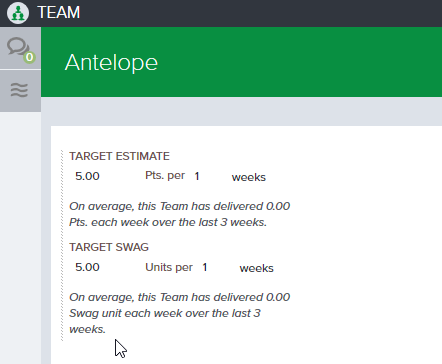
Under each Target attribute, Digital.ai Agility calculates a value from the Teams history based on the duration specified above. Once the team has some history, you can use this value to ensure your anticipated delivery aligns with historical data.
3. From the Portfolio Tree we see that the Antelopes have committed to 3 Portfolio Items. Two of those Portfolio Items have a Swag of 8 and the third one has a Swag of 40. This give the Antelopes a Total Swag commitment of 56, which is 6 Swag units more than the anticipated capacity, or 112% of anticipated capacity.
4. The total estimate for all stories assigned to the Antelopes is 4 points, which represents 8% of the total anticipated estimate capacity. Obviously still early in planning.
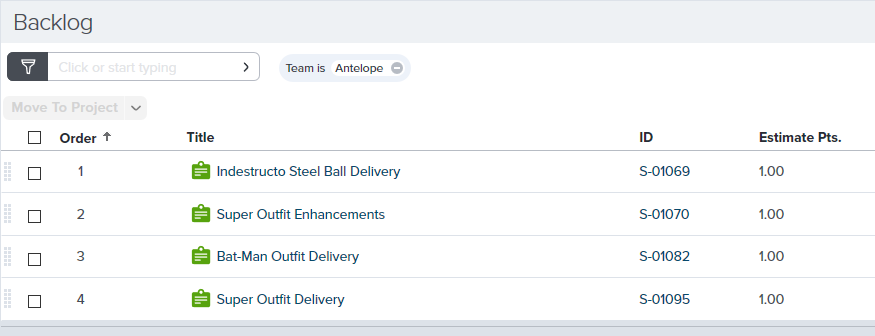
These backlog items may, or may not, be associated with the Portfolio Items the Antelopes have committed to deliver. Therefore, it's important to use the Backlog grid to find the total estimate and not rely on the total estimate associated with the Portfolio Items.