Building a Custom Report
This article explains how to build a Custom Report in Agility.
Overview
The Report Management page contains a list of all reports that are available to you. You can create new reports and dashboards, organize them in folders, and depending on the options schedule and subscribe to reports.
Use buttons at the top of the page to create new items, copy or move them into any folder, or remove unneeded items.
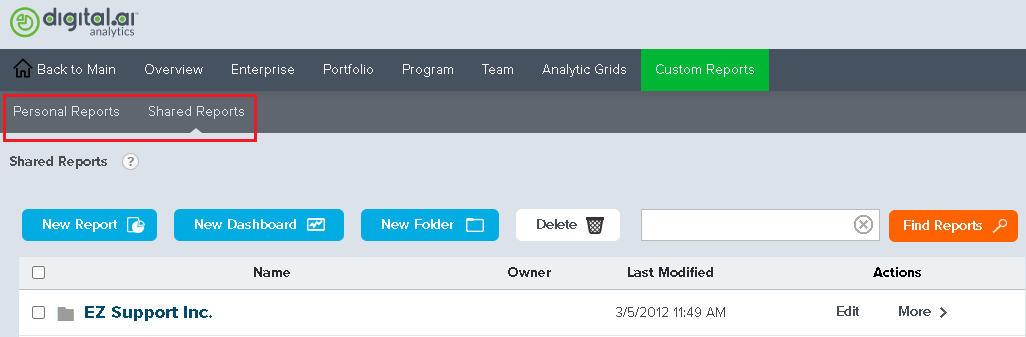
Accessing Custom Reports
To access Custom Reports, click the hamburger menu ![]() > Analytics, and click the Personal Reports or Shared Reports tab.
> Analytics, and click the Personal Reports or Shared Reports tab.
- The Personal Reports tab displays the list of custom report definitions, custom dashboard definitions, or folders that you created.
- The Shared Reports tab displays a list of custom report definitions, custom dashboard definitions, and folders available to everyone in the organization.
If no report definitions have been created, these lists are empty.
Working with Custom Reports
- For each item in the list, we see who created the item and the last date the definition was modified. The last column, Actions, contains a hidden menu of actions that you can perform on an individual definition. In Personal Reports, these actions are: Modify, Rename, Copy, Move, Delete. These are the same actions you see in Shared Reports if you are the definition owner. If you are not the definition owner, you can only copy the definition, unless you are a System Administrator in Digital.ai Agility. Members who are System Administrators in Digital.ai Agility may also move or delete a definition in the Shared Reports area. Click the ">" character to reveal the list of available actions.
Using the Report Wizard
The Report Builder is a comprehensive and flexible interface designed to build full-featured reports.
The Report Builder is not designed to build or modify dashboards.
The New Report and New Dashboard buttons at the top of the page allow you to create new custom report definitions, custom dashboard definitions, or folders. This is explained in more detail in the Custom Reporting section of our Development Community.
Step 1. Create a new report and select a data source.
-
Click the New Report button, select a report template, and click OK.
-
In the Select Data window,
-
- From the Data Objects in drop-down list, select the data object category on which the report will be based.
- (Optional) Select the Exclude duplicate rows check box and click on the tabs to configure additional report options.
-
- Expand a data object to see the associated columns.
- Click on the search icon to see sample data.
- Hover your mouse over an object or column to see a description in the Information panel.
-
- Click OK.
-
On the New Report page, click the Header tile at the left hand side. In the Modify section, click the header image and check or uncheck the Date and Time boxes as required. The Header determines the column header displayed when the report is rendered.
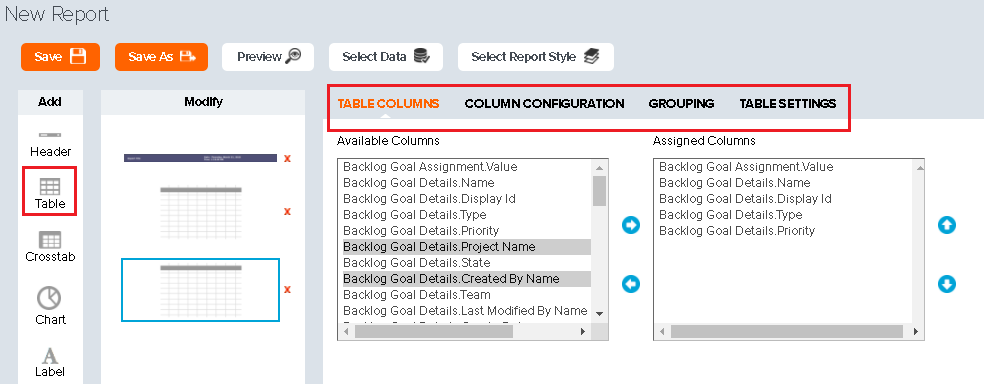
Step 2. Configure table columns.
- Click the Table tile and click on the Table Columns tab. This is where you select the columns you want to add to the table.
- In the Available Columns box, select columns you want to add and click the right arrow to move them to the Assigned Columns box.
- When done assigning and arranging columns, click Save.
Step 3. Click on the Column Configuration tab to set up the display elements.
- While on the Table page, click on the Column Configuration tab to begin formatting the appearance of each column.
- Initially, only the Column, Header and Sortable columns are displayed. Click Show All Attributes to view all column attributes.
- Click Add a Custom Column to add columns not available in this list.
Step 4. Click on the Grouping Tab to set up table styles.
The Grouping tab allows you to choose how you want to group the data in the table. Tables can be grouped using one of three styles - No grouping, Flat-Table and Drill-Down. The grouped flat-table style organizes records into groups and hides duplicate entries to make the grouped report more presentable. Use the flat-table style to give other users the ability to export the complete report to different formats such as PDF and Microsoft Excel. The grouped drill-down style organizes records into groups and any remaining columns are included in a sub-report. Use the drill-down style to give other users the ability to hide and show sub-reports.
The feasibility of grouping data highly depends on the data source chosen for the report. A grouped report is not necessarily appropriate when the data is simply a list of customers. If the data source contains information about customers and orders, a grouped report will definitely improve the presentation of the report. The application provides two ways to group data for flat-table and drill-down style reports - multiple grouping columns and multiple layers. Users can combine both methods when creating grouped reports.
Step 5. Click on the Table Settings tab to choose the display format.
The Table Settings tab offers the ability to control the general characteristics of the display table. It offers the ability to specify a table title and add paging controls for large result sets. Interactive paging controls can be added for the entire table as well as individual sub-reports in a drill-down style grouped table.
Deleting a Custom Report
- On the Personal Reports or Shared Reports page, select the report to be deleted and click Delete.