Backlog Advisor Dashboard
The Backlog advisor dashboard delivers actionable insights to optimize backlog management by organizing work items into categories and providing targeted recommendations. It visually represents work items grouped into categories such as Review & Update, Cancel, and Deliver, along with their counts and percentages for a quick priority assessment. A comprehensive tabular view offers detailed work item information, enabling teams to analyze and monitor progress effectively. The dashboard also provides specific recommendations, such as canceling outdated tasks or prioritizing actionable items. With its intuitive design and real-time data, it empowers teams to resolve bottlenecks, enhance prioritization, and maintain an organized and efficient backlog.
You can customize the bucket classification to suit your specific requirements.
The Last refresh date on this dashboard refers to the date and time when the data displayed on the dashboard was last updated or refreshed from the underlying data sources. You can know the data's freshness and make informed decisions based on the most recent information.
As a DevOps Manager, you can use the Backlog advisor Dashboard to:
- Identify and categorize work items into actionable groups, such as "Review & Update," "Cancel," and "Deliver," enabling focused prioritization.
- Detect and eliminate outdated or low-priority tasks to streamline workflows.
- Monitor the progress and status of individual work items to ensure timely updates and effective task tracking.
- Leverage actionable recommendations to address bottlenecks and maintain a healthy, well-organized backlog.
- Analyze iteration details and backlog trends to enhance planning and resource allocation for future sprints.
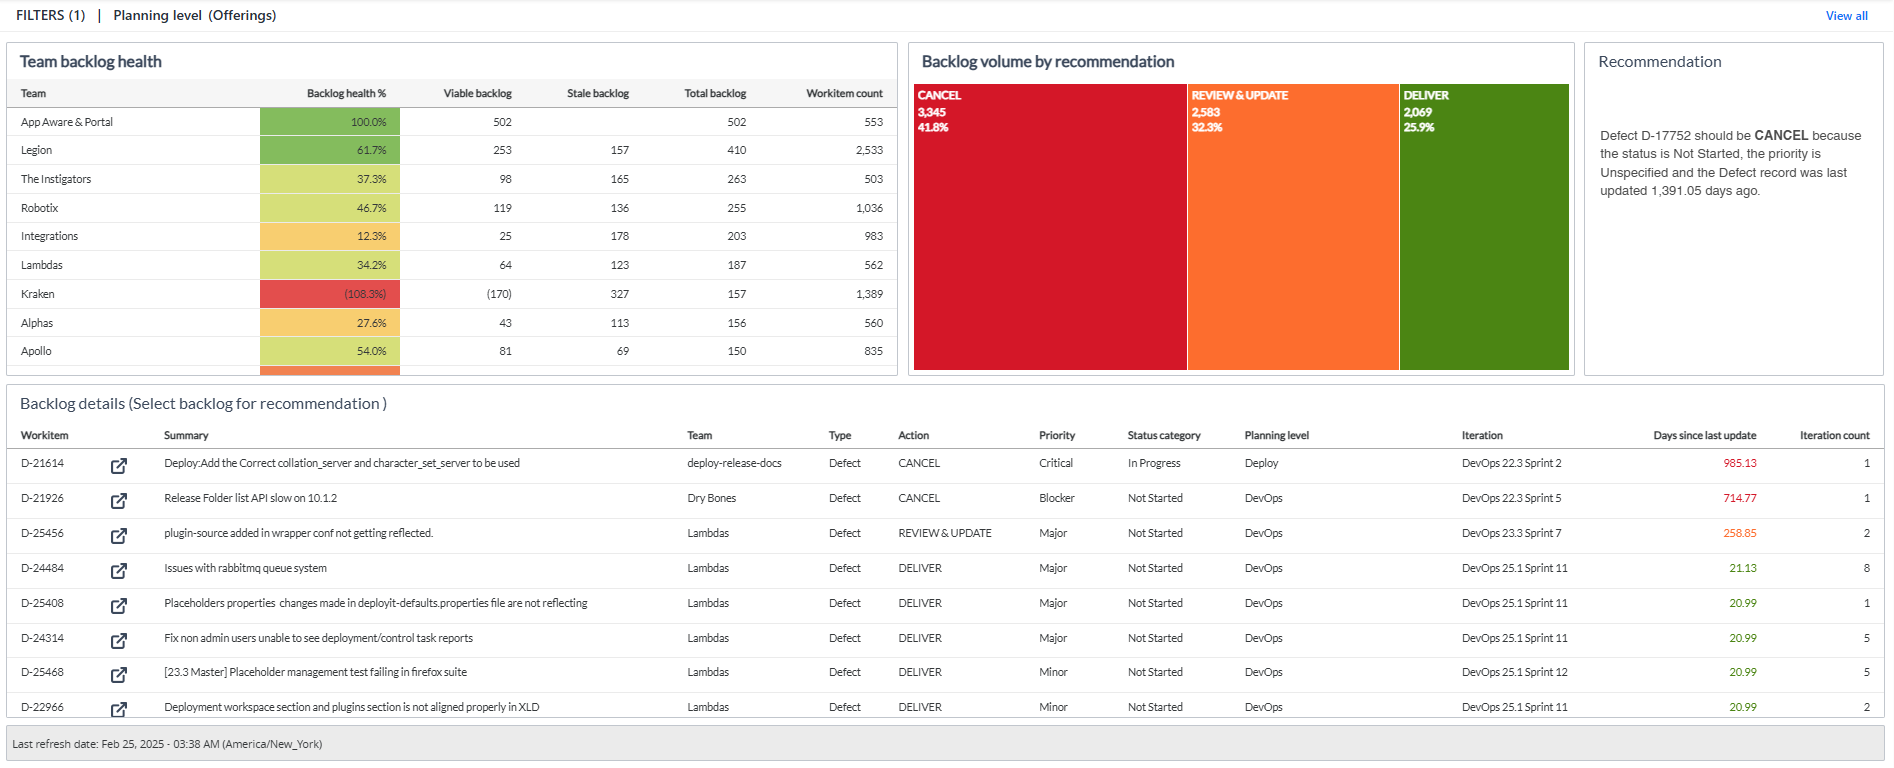
Here is a screenshot of backlog advisor dashboard.
The Backlog Advisor dashboard is built using the work item base, planning level hierarchy, workitem backlog, and agility last refresh date datasets.
You can filter the required planning levels from the drop down and the grids display the data respectively.
The Backlog advisor dashboard consists of the following sections:
Team backlog health
Provides an overview of backlog status across teams to support backlog management and prioritization. It displays key metrics, including Backlog health%, Viable backlog, Stale backlog, Total backlog, and Workitem count. A higher backlog health percentage (green) indicates a well-maintained backlog, while lower percentages (yellow or red) highlight areas that need attention. Teams with negative backlog health have more stale items than viable ones, requiring immediate action. A 100% backlog health score indicates a fully maintained backlog. A high percentage of stale backlog suggests prioritization issues, while a moderate backlog health score indicates room for improvement. This panel helps teams identify backlog inefficiencies and take corrective actions to improve workflow management.
This panel displays only teams with backlog items, excluding teams without backlog. This ensures the focus remains on backlog optimization, highlighting teams that require action rather than providing a static backlog status.
Backlog Volume by Recommendation
Provides a visual representation of backlog recommendations categorized into three groups: review & update, cancel, and deliver. Each category is displayed with its respective count and percentage, offering a quick overview of the distribution of work items. The color-coded sections allow you to easily identify the volume and proportion of work items in each category, enabling efficient prioritization and decision-making to manage the backlog effectively.
Recommendation
Provides specific, actionable suggestions for individual work items based on their attributes to help teams optimize backlog management and reduce unnecessary costs. For example, it identifies items that should be canceled due to prolonged inactivity or low priority, preventing resource waste on outdated or redundant tasks. By recommending timely actions, this feature improves efficiency and supports cost-saving efforts.
Backlog Details (Select Backlog for Recommendation)
Displays a detailed list of backlog items, showing the Workitem number, Source URL, Summary, Team, Type, Action, Priority, Status category, Iteration, Days since last update, and Iteration count. The table helps teams manage and analyze backlog items by providing an overview of the current state of each item, highlighting overdue updates, and facilitating decision-making on whether to continue, cancel, or prioritize specific work items.
Components of Dataset
This section lists all the attributes and metrics that have been used to build the reports in this dashboard.
Attributes
| Attribute Name | Description | Dataset |
|---|---|---|
| Action | The set of action need to be taken based on the number of days the work item is in backlog state | Workitem backlog |
| Backlog | The collection of pending work items awaiting completion, providing insight into workflow bottlenecks and team progress | Workitem backlog |
| Backlog type | Type of the backlog | Workitem backlog |
| Iteration | The sprint or timebox associated with a work item, helping track its progress within the backlog. | Workitem backlog |
| Planning level | The hierarchical level at which a work item is planned, helping to organize and manage tasks within the backlog. | Workitem backlog |
| Priority | Priority of the work item | Workitem backlog |
| Source URL | URL of the work item | Workitem backlog |
| Status | Status of the work item | Workitem backlog |
| Status category | Current state category of the work item | Workitem backlog |
| Summary | Summary of the work item | Workitem backlog |
| Team | The team responsible for managing the backlog items. | Workitem base |
| Type | Type of the work item | Workitem backlog |
| WI | Description of the work item | Workitem backlog |
| Workitem | Unique identifier of the work item | Workitem backlog |
| Workitem priority | Priority of the work item | Workitem backlog |
| Workitem source URL | URL of the work item | Workitem backlog |
| Workitem status category | Current state category of the work item | Workitem backlog |
| Workitem type | Type of the work item | Workitem backlog |
Metrics
| Metric Name | Description | Dataset |
|---|---|---|
| Backlog health % | It reflects the percentage of viable backlog items, showing the overall health and upkeep of the backlog. | Workitem base |
| Contribution % | The proportion of work items contributed, calculated as the number of work items divided by 100. | Workitem backlog |
| Count (Workitem) | The distinct count of work items in the backlog. | Workitem backlog |
| Days since last update | The difference between last updated date and the current date in seconds | Workitem backlog |
| Iteration count | Distinct count of the iteration to the work item it is linked to | Workitem backlog |
| Stale backlog | Count of work items that are not started or in progress but marked for cancellation. | Workitem base |
| Total backlog | The distinct count of all work items in the backlog. | Workitem base |
| Viable backlog | Count of the backlog items that are not canceled, showing the actionable work items remaining. | Workitem base |
| Work items | Total number of the work item | Workitem backlog |
| Workitem count | The distinct count of work items based on their unique identifiers. | Workitem base |