Portfolio dashboard
The Portfolio dashboard provides comprehensive insights into the performance and status of multiple projects within an organization's portfolio. It gives real-time insights and visualizations, facilitating the effective management and optimization of project portfolios. This dashboard enables organizations to achieve better control over their project portfolios, ensuring efficient management and alignment with business goals. It is crucial for tracking performance, managing resources, and driving project success.
This dashboard has the following pages:
Agile Earned Value by Date
The Agile Earned Value by Date page enables you to compare the planned work, actual progress, and delivered results in a project or planning level over time. The panel includes a bar graph representing the velocity, indicating how much work is completed during each period. This panel is an agile alternative to traditional earned value reporting in project or planning level management.
This page is built using the agile earned value by date, planning level hierarchy, work item goals, backlog group hierarchy, portfolio item hierarchy, and planning level programs datasets.
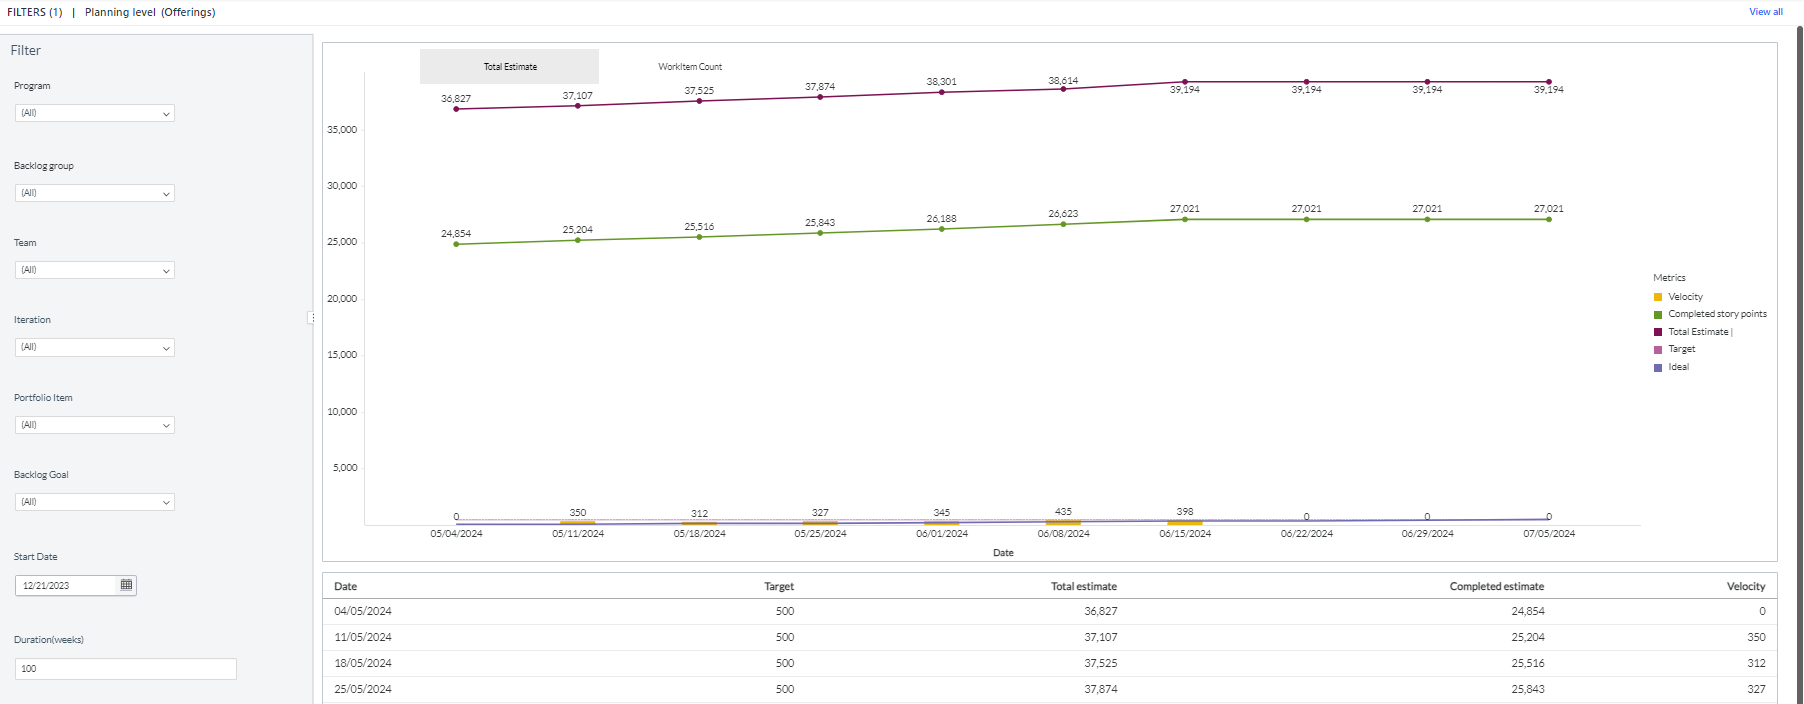
Agile Earned Value by Date
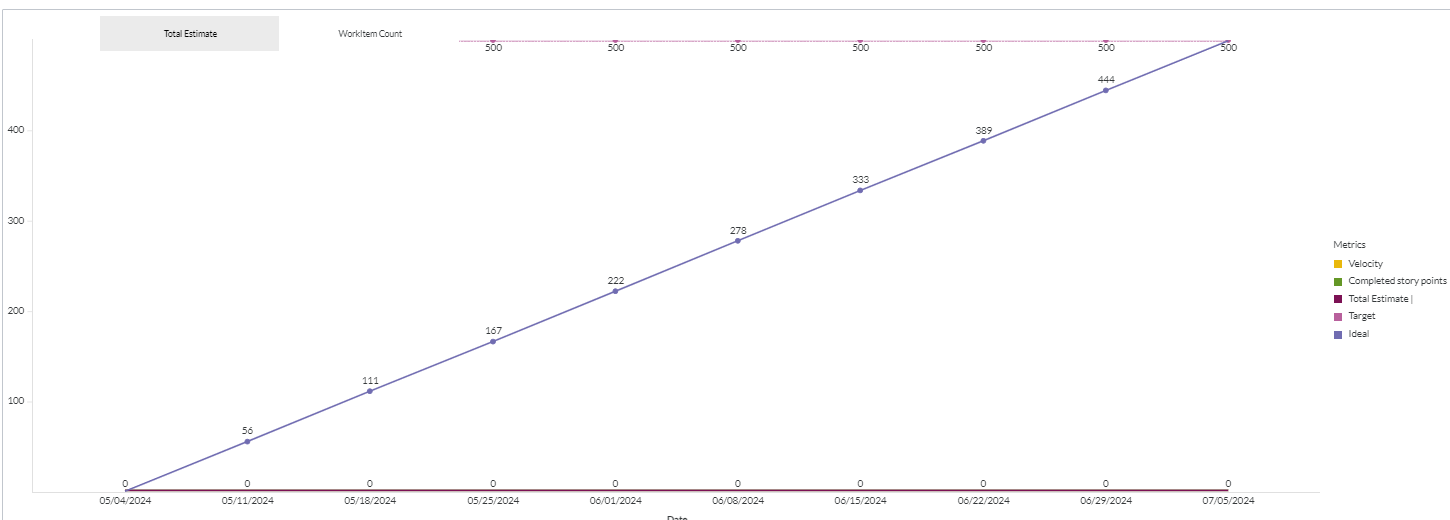
Provides a visual representation of the project or planning level's progress over time. The x-axis represents the calendar date, and the y-axis represents the total estimate or work item count. This panel has the following trend lines:
- Target: This line represents the target or baselined work item count or total estimate for the selected project or planning level.
- Completed work items or story points: This line represents the total amount of project or planning level work item count or total estimate at the end of each iteration.
- Total work items or story points: This line represents the work item count or total estimate defined in the project or planning level on the first day of the project or planning level and at the end of each iteration.
- Guide Line: This line represents how much work would need to be delivered in each period to deliver the target estimate in the specified number of iterations.
- Velocity: This bar represents either the work item count or total estimate in each iteration, depending on the currently selected tab.
The grid displays details like calendar date, targeted work, velocity of each iteration, total estimate or total count of work items, and completed estimate or completed count of work items.
Here is a screenshot of the Agile earned value by date dashboard.
You can filter and view the required data using the following filters:
- Planning level: Displays data of work items in the selected planning level and all child planning levels that belong to the planning level.
- The following filters display filter values based on the filtered planning level.
- The following filters cascade each other except the Start date and Duration filters.
- Program: Displays data of work items in the selected program.
- Team: Displays data of a specific group of cross-functional members.
- Backlog group: Displays data of work items in the selected backlog group and child backlog group that belongs to the backlog group.
- Iteration: Displays data of a specific planning period for an Agile team.
- Portfolio item: Displays data of work items in the selected portfolio item and all child portfolio items that belong to the portfolio item.
- Start date: Displays data of work items in the selected start date.
- Duration: Displays data of work items in the selected duration types like 50 days, 20 weeks, and 10 months.
- Target: Displays data of the selected target value.
- Group by: Displays data of work items in any of the following dimensions: total estimate and work item count.
You can use these filters to refine the displayed data. For example, you can choose a backlog goal from the Backlog goal filter to view the corresponding page. Here is an example backlog goal-filtered panel.
Components of dataset used in this page used in this page
The following components of the dataset are used in this page:
Attributes
| Attribute Name | Description | Dataset |
|---|---|---|
| Calendar date | Gregorian calendar date displayed in the format 'D/M/YYYY' | Agile earned value by date |
Metrics
| Metric Name | Description | Dataset |
|---|---|---|
| Completed story points | The total amount of project or planning level work completed at the end of each iteration. | Agile earned value by date |
| Completed work items | The total amount of project or planning level work completed at the end of each iteration. | Agile earned value by date |
| Guide Line | Work would need to be delivered in each period to deliver the target estimate in the specified number of iterations. | Agile earned value by date |
| Target | Target or baselined work items for the selected project or planning level. | Agile earned value by date |
| Total Estimate | Summation of all estimate points of the backlog item in the iteration | Agile earned value by date |
| Completed Estimate | Summation of all completed estimate points of the backlog item in the iteration | Agile earned value by date |
| Total count | Count of work items in an iteration | Agile earned value by date |
| Completed count | Count of completed work items at the end of each iteration. | Agile earned value by date |
| Velocity | The total amount of work completed in each iteration. | Agile earned value by date |
| Velocity work item | The total amount of work completed in each iteration. | Agile earned value by date |
Portfolio Item Delivery by Planning Level
The Portfolio Item Delivery by Planning Level page provides insights into the distribution and alignment of work across projects or planning levels based on where all child portfolio items are planned, aiding organizations in optimizing their delivery processes and achieving business objectives. The page enables stakeholders to assess the distribution of portfolio item deliveries across various planning levels within the organization.
This page is built using the planning level hierarchy, portfolio item hierarchy, planning level programs, portfolio item summary, and portfolio item strategic themes datasets.
Here is a screenshot of the Portfolio item delivery by planning level dashboard.
You can filter and view the required data using the following filters:
- Planning level: Displays data of portfolio items in the selected planning level and all child planning levels that belong to the planning level.
- The following filters display filter values based on the filtered planning level.
- The following filters cascade each other except the Aggregation filter.
- Program: Displays data of portfolio items in the selected program.
- Status: Displays data of portfolio items in any of the following statuses: discovery, done, in progress, ready for dev, review, and unspecified.
- Priority: Displays data of portfolio items in any of the following priorities: high, medium, low, and unspecified.
- Type: Displays data of portfolio items in any of the following portfolio item types: epic, feature, initiative, non-functional, sub-feature, and unspecified.
- Strategic theme: Displays data of portfolio items in the selected strategic theme. Strategic themes are vital for guiding organizational strategy, prioritizing initiatives, aligning efforts, fostering collaboration, and driving long-term success in Agility.
- Aggregation: Displays data of portfolio items in any of the following aggregation types: all child portfolio items count, total swag, total value, backlog work item count, and total estimate.
You can use these filters to refine the displayed data. For example, you can choose a program from the Program filter to view the corresponding page. Here is an example program-filtered panel.
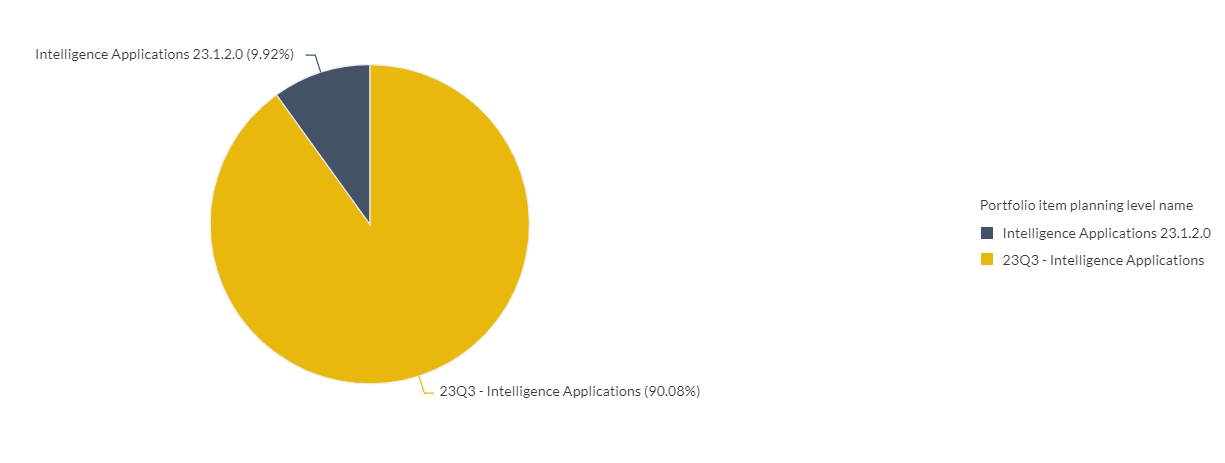
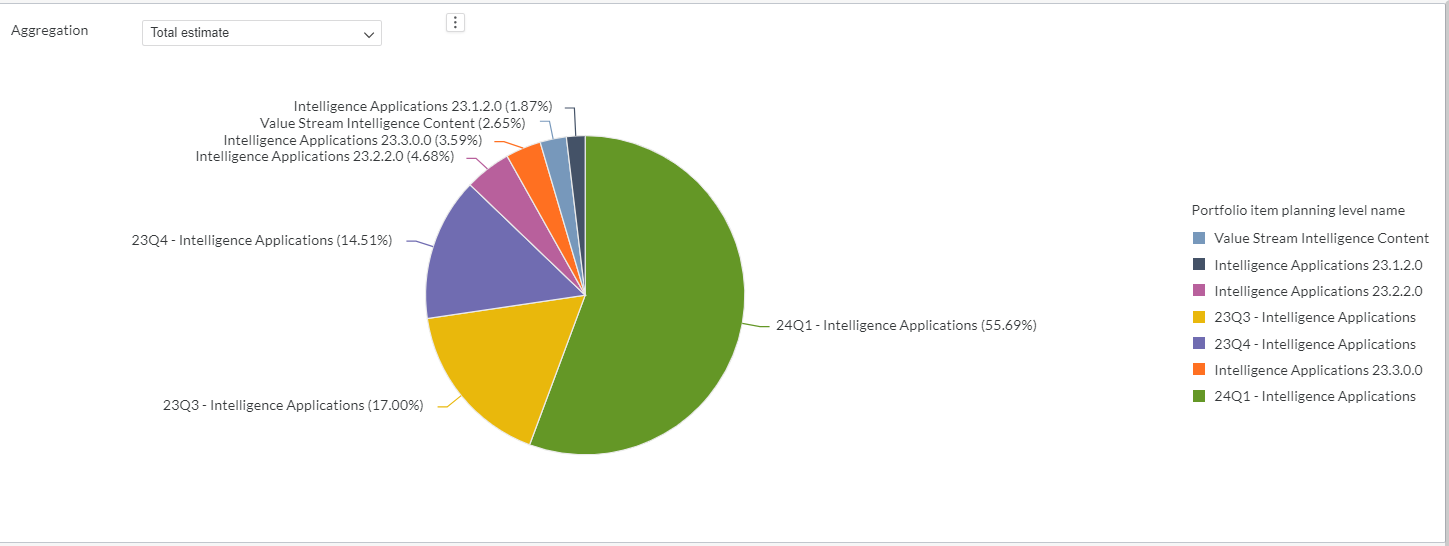
Portfolio Item Delivery by Planning Level
Displays a summary of portfolio items organized by planning level. This panel analyzes the immediate child portfolio items within a selected project or planning level, utilizing their project or planning level assignment. It aggregates data based on all child portfolio items count, total swag, total value, backlog work item count, and total estimate. You can hover the cursor over the panel to see the planning level name, percentage contribution, all child portfolio items count, total swag, total value, backlog work item count, and total estimate. This panel has the following aggregation types:
- all child portfolio items count: Count of all child portfolio items within each delivery project or planning level.
- Total estimate: Total estimate of backlog work item in each delivery project or planning level.
- Backlog work item count: Count of backlog items in each delivery project or planning level.
- Total swag: Total amount of Swag in each delivery project or planning level.
- Total value: Total amount of value in each delivery project or planning level.
Chart data
Displays details of immediate child portfolio items including their ID, source URL, name, planning level, backlog work item count, total swag, total value, and total estimate. Each row represents a different child portfolio item within the selected planning level or program.
You can also click the ![]() icon against the portfolio item ID to launch the source system and view more work item details such as status, description, owner and team.
icon against the portfolio item ID to launch the source system and view more work item details such as status, description, owner and team.
Portfolio items
Displays details of top-most portfolio items including their ID, source URL, name, planning level, backlog work item count, total swag, total value, and total estimate. Each row represents a different top-most portfolio item within the selected planning level or program.
You can also click the ![]() icon against the portfolio item ID to launch the source system and view more work item details such as status, description, owner and team.
icon against the portfolio item ID to launch the source system and view more work item details such as status, description, owner and team.
Components of dataset used in this page used in this page
The following components of the dataset are used in this page:
Attributes
| Attribute Name | Description | Dataset |
|---|---|---|
| Portfolio item planning level name | Planning level of the portfolio item | Portfolio item summary |
| ID | Unique identifier of the portfolio item | Portfolio item summary |
| Source URL | URL of the source. It contains a link to the source system. | Portfolio item summary |
| Name | Name of the portfolio item | Portfolio item summary |
| Planning level | Name of the planning level | Portfolio item summary |
Metrics
| Metric Name | Description | Dataset |
|---|---|---|
| Backlog work item count | Count of backlog items in each delivery project or planning level | Portfolio item summary |
| All child portfolio items count | Count of all child portfolio items within each delivery project or planning level. | Portfolio item summary |
| Total estimate | Summation of all estimate points of the backlog item in the iteration | Portfolio item summary |
| Total swag | Total amount of Swag in each delivery project or planning level | Portfolio item summary |
| Total value | Total amount of value in each delivery project or planning level | Portfolio item summary |
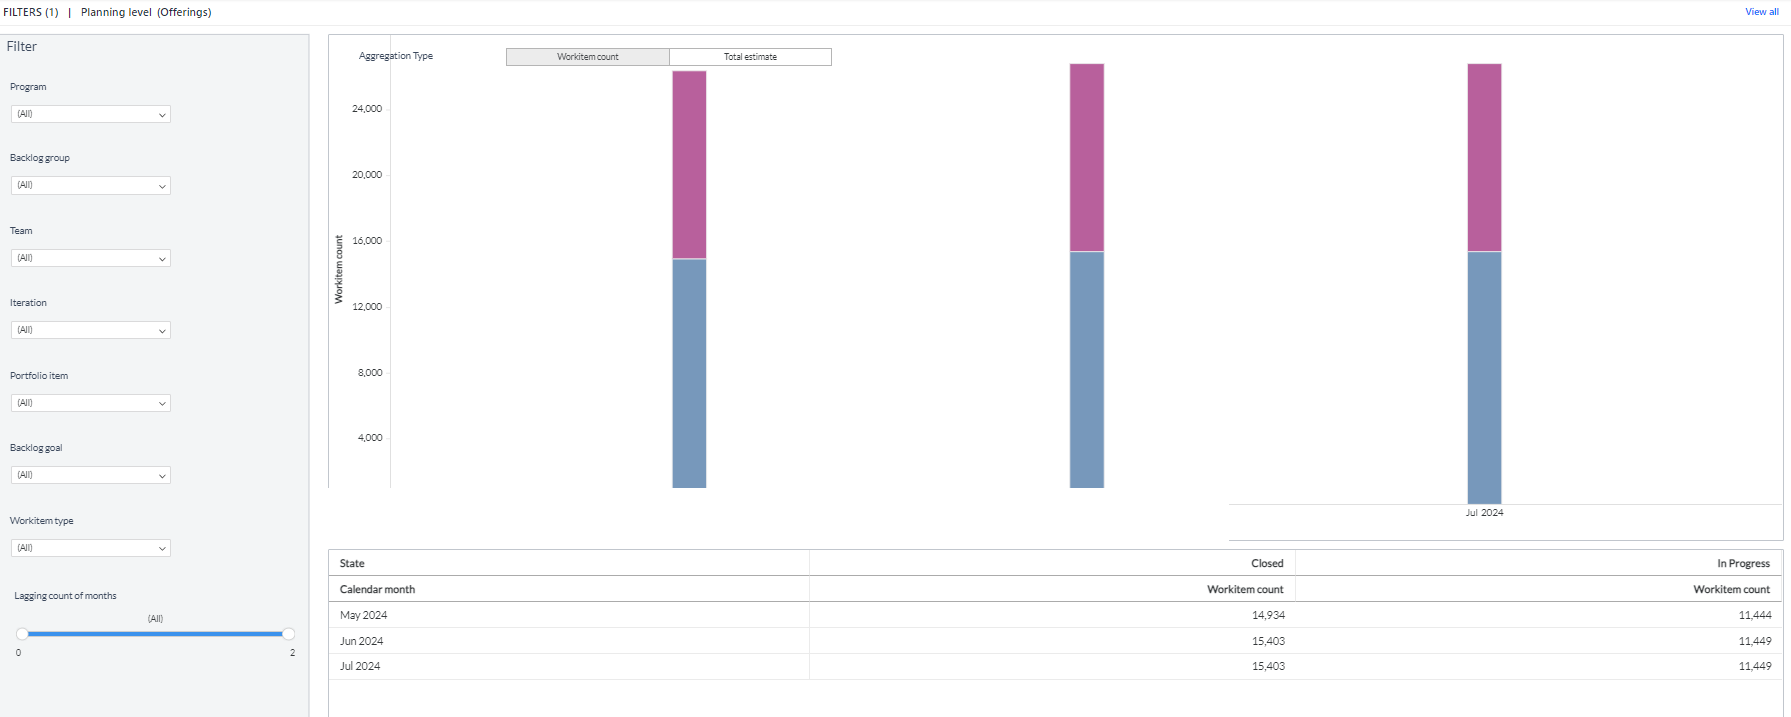
Work Item Trend
The Work Item Trend page enables you to observe how work items change over different periods, offering insights into their trends and evolution. It enables you to assess the progress and effectiveness of your development activities by tracking how work items advance or get resolved over time. By studying the trend data, you can identify deviations from expected patterns. This helps in spotting issues or areas that might need attention or intervention. You can break down the information based on various factors, such as portfolio items or teams.
This page is built using the work item in status, planning level hierarchy, work item goals, backlog group hierarchy, portfolio item hierarchy, planning level programs, and work item snapshot monthly datasets.
Work Item Trend
Displays trend analysis and detailed information about work items in a program. Within the grid, you can find work item details such as calendar date and work item count in different work item statuses like unspecified, completed, and in progress. Using the Aggregation Type filter, you can view the trend of work items on different dimensions like work item count and total estimate. Each bar on this panel represents a date. The height of the bar represents the total number of work items in the selected planning level or program on that date. The X-axis represents the calendar date, and the Y-axis represents the work item count. You can hover over the panel to see the calendar date, state, status, and work item count.
Here is a screenshot of the Work item trend dashboard.
You can filter and view the required data using the following filters:
- Planning level: Displays data of work items in the selected planning level and and all child planning levels that belong to the planning level.
- The following filters display filter values based on the filtered planning level.
- The following filters cascade each other except the Start date and Duration filters.
- Program: Displays data of work items in the selected program.
- Team: Displays data of a specific group of cross-functional members.
- Backlog group: Displays data of work items in the selected backlog group and child backlog group that belongs to the backlog group.
- Iteration: Displays data of a specific planning period for an Agile team.
- Portfolio item: Displays data of work items in the selected portfolio item and all child portfolio items that belong to the portfolio item.
- Backlog goal: Displays data of work items in the selected backlog goal.
- Work item type: Displays data of work items in any of the following work item types: Defect, Story, and Test set.
- Start date: Displays data of work items in the selected start date.
- Duration: Displays data of work items in the selected duration types like 50 days, 20 weeks, and 10 months.
- Aggregation type: Displays data of work items in any of the following aggregation types: work item count and total estimate.
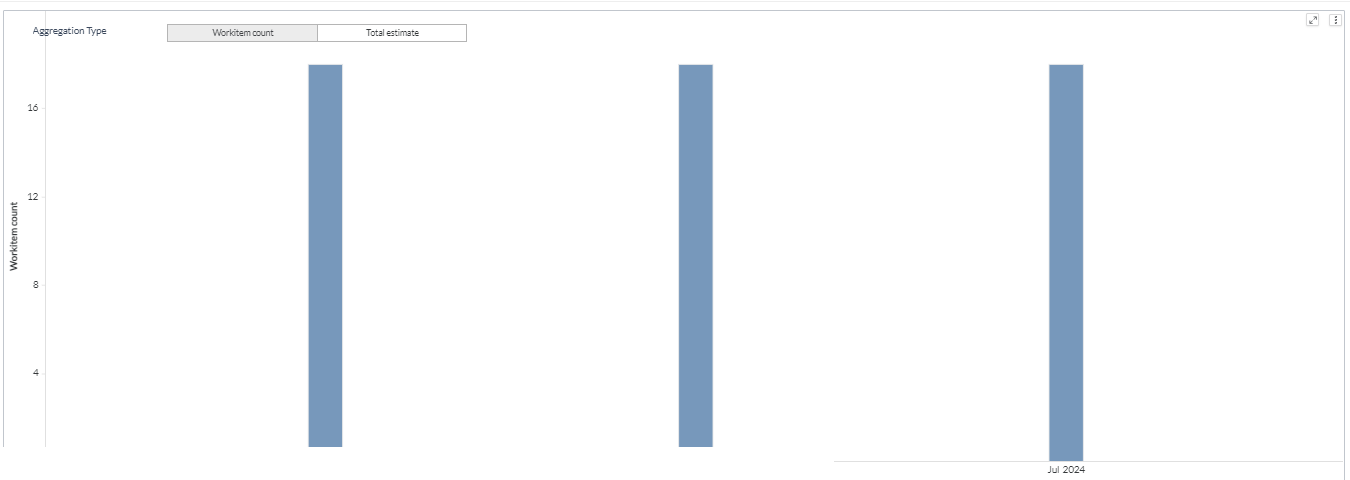
You can use these filters to refine the displayed data. For example, you can choose an iteration from the Iteration filter to view the corresponding work item trend page. Here is an example iteration-filtered panel.
Components used in this page
The following components of the dataset are used in this page:
Attributes
| Attribute Name | Description | Dataset |
|---|---|---|
| Calendar Date | Gregorian calendar date displayed in the format 'D/M/YYYY' | Workitem snapshot monthly |
| State | Current state of the Work Item | Workitem snapshot monthly |
| Work item Status | Current status of the Work Item | Workitem snapshot monthly |
Metrics
| Metric Name | Description | Dataset |
|---|---|---|
| Total Estimate | Summation of all estimate points of the backlog item in the iteration | Workitem snapshot monthly |
| Work Item Count | Count of work items in an iteration | Workitem snapshot monthly |
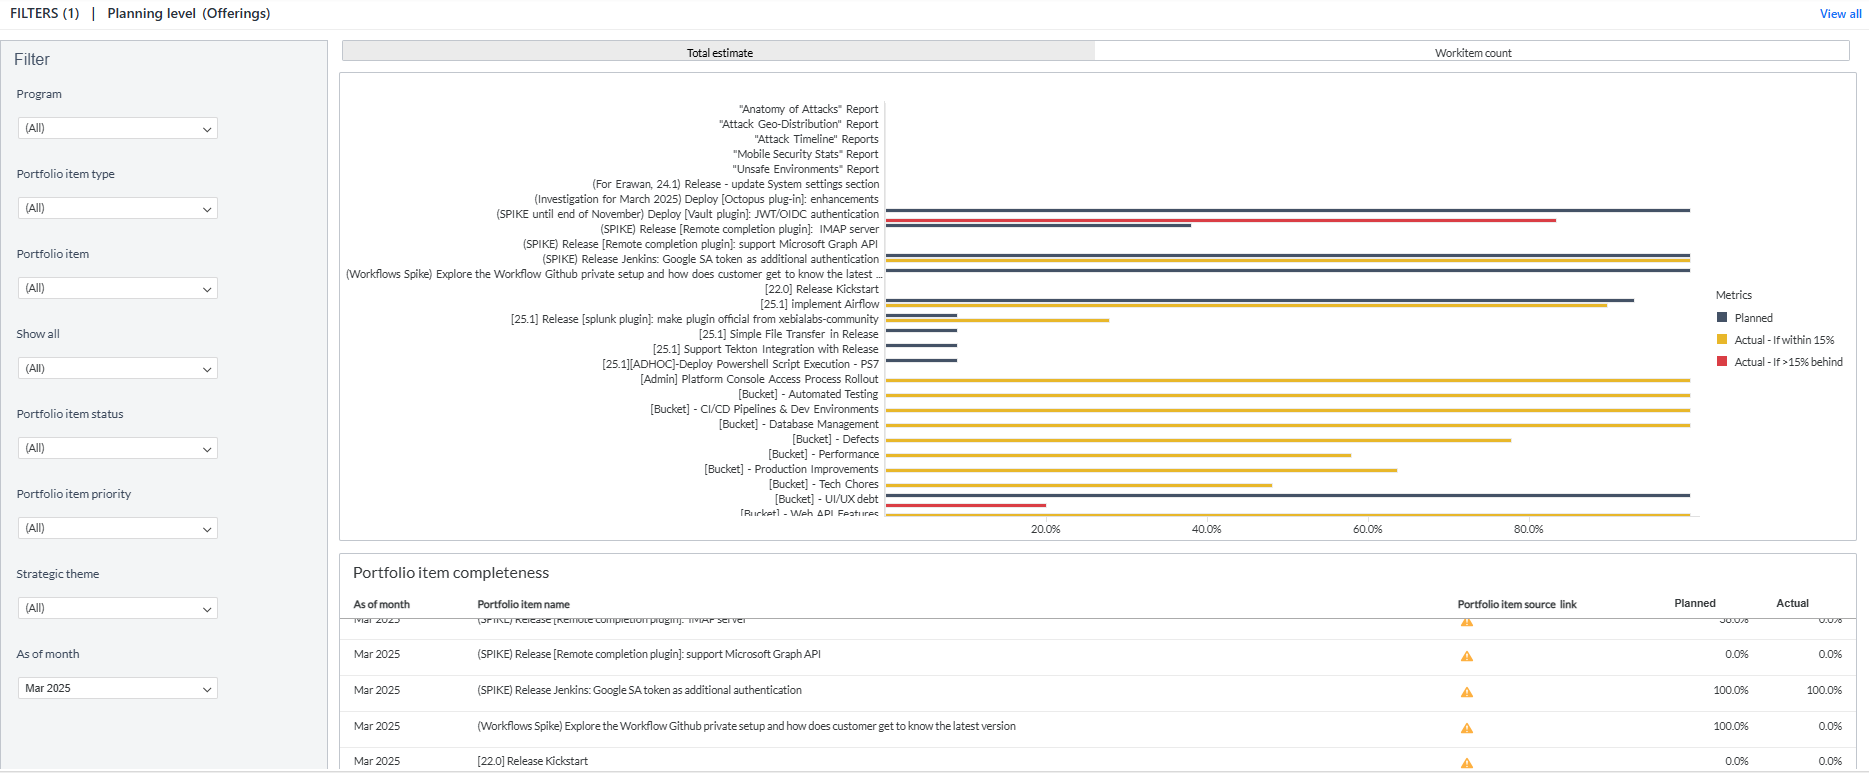
Portfolio Item Completion
The Portfolio Item Completion page provides insights into overall portfolio performance, such as completion rates, average time to completion, and trends over time. The page enables you to track the progress of various items within a portfolio of projects. It provides a visual representation of the status of each item, allowing stakeholders to quickly assess which items are on track, delayed, or completed.
This page is built using the planning level hierarchy, portfolio item hierarchy, planning level programs, portfolio item strategic themes and portfolio item monthly snapshot datasets.
The Portfolio Item Completion page consists of the following tabs:
- Total Estimate: This tab presents insights into portfolio item completion based on the total estimates assigned to the backlog items.
- Work Item Count: This tab presents details of portfolio item completion based on the count of backlog items.
Here is a screenshot of the Portfolio item completion dashboard.
You can filter and view the required data using the following filters:
- Planning level: Displays data of portfolio items in the selected planning level and all child planning levels that belong to the planning level.
- The following filters display filter values based on the filtered planning level.
- The following filters cascade each other except the As of date filter.
- Program: Displays data of portfolio items in the selected program.
- Portfolio item type: Displays data of portfolio items in any of the following portfolio items: epic, feature, initiative, non-functional, sub-feature, and unspecified.
- Portfolio item: Displays data of portfolio items in the selected portfolio item and all child portfolio items that belong to the portfolio item.
- Show all- Displays data of portfolio items in any of the following item types: parent and child.
- Portfolio item status: Displays data of portfolio items in the portfolio item statuses such as discovery, done, in progress, ready for dev, review, and unspecified.
- Portfolio item priority: Displays data of portfolio items in the portfolio item priorities such as high, medium, low, and unspecified.
- Strategic theme: Displays data of portfolio items in the strategic themes such as prototype, DevOps-SaaS, shift left uptake, and unspecified.
- As of date: Displays data of portfolio items in the selected start date.
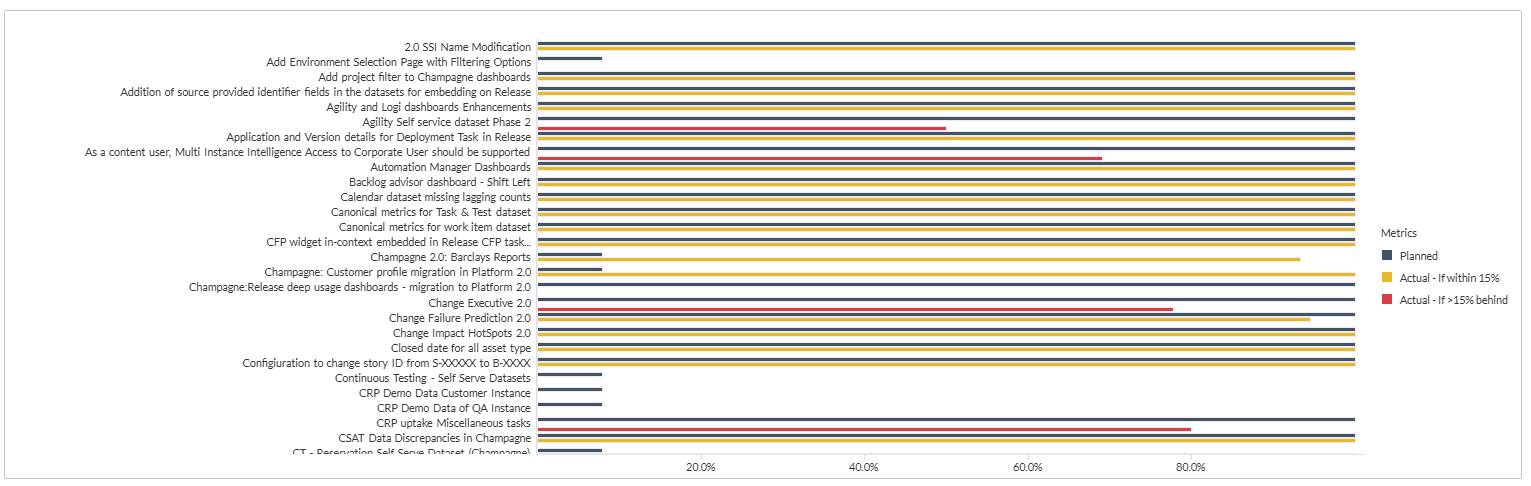
You can use these filters to refine the displayed data. For example, you can choose a program from the Program filter to view the corresponding page. Here is an example program-filtered panel.
Portfolio Item Completion
Displays an overview of the status of various items within a portfolio. You can use the portfolio item type filter to view the progress of the selected portfolio item within the planning level. The different portfolio item types are epic, feature, initiative, non-functional, sub-feature, and unspecified. The x-axis represents the percentage, and the y-axis represents the selected portfolio items. You can hover the cursor over the panel to see the name of the portfolio item and the actual or planned completion percentage.
Portfolio item completeness
Displays details of portfolio items including calendar date, portfolio item name, portfolio item source link, planned and actual portfolio items completed portfolio items. Each row represents a different portfolio item within the selected planning level or program.
You can also click the ![]() icon against the portfolio item name to launch the source system and view more portfolio item details such as status, description, owner and team.
icon against the portfolio item name to launch the source system and view more portfolio item details such as status, description, owner and team.
Components used in this page
The following components of the dataset are used in this page:
Attributes
| Attribute Name | Description | Dataset |
|---|---|---|
| As of date | Gregorian calendar date displayed in the format ‘M/D/YYYY’ | Portfolio item monthly snapshot |
| Portfolio item title | Title of the portfolio item | Portfolio item monthly snapshot |
| Portfolio item source link | source link of the portfolio item | Portfolio item monthly snapshot |
| Portfolio item name | Name of the portfolio item | Portfolio item monthly snapshot |
Metrics
| Metric Name | Description | Dataset |
|---|---|---|
| Actual | Actual estimate completion percentage | Portfolio item monthly snapshot |
| Actual | Actual work item completion percentage | Portfolio item monthly snapshot |
| Actual - If>15% behind | Actual estimate greater than 15 percentage | Portfolio item monthly snapshot |
| Actual - If within 15 % | Actual estimate within 15 percentage | Portfolio item monthly snapshot |
| Actual - If>15% behind | Actual work item count completion percentage greater than 15 | Portfolio item monthly snapshot |
| Actual - If within 15 % | Actual work item count completion percentage within 15 | Portfolio item monthly snapshot |
| Planned | Planned completion percentage of portfolio items | Portfolio item monthly snapshot |
| Planned completion | Planned completion percentage of portfolio items | Portfolio item monthly snapshot |
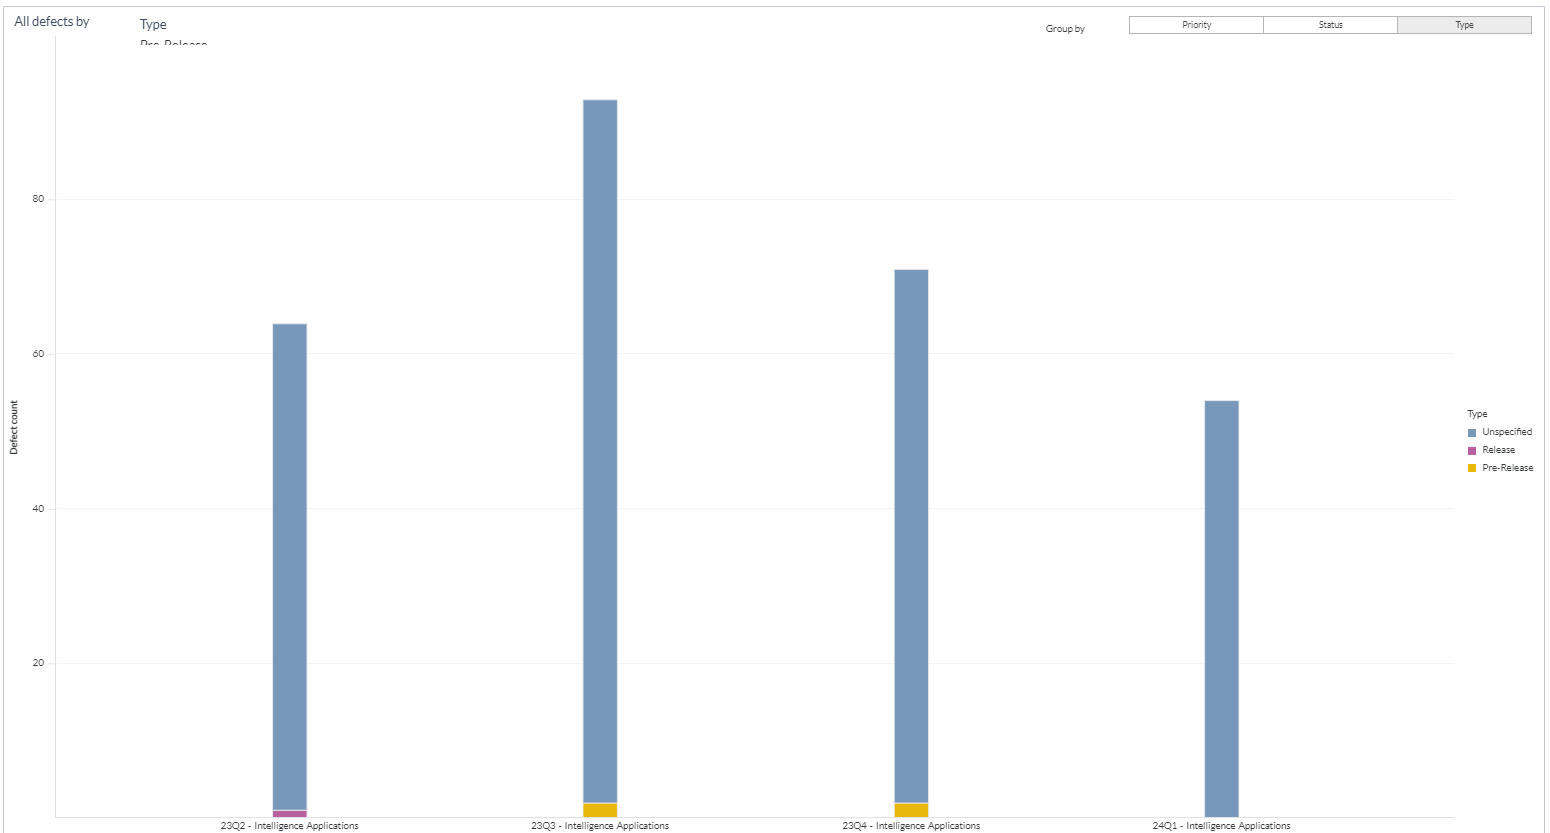
Defect Trend by Planning Level
The Defect Trend by Planning Level page provides insights into how defects trend across a group of planning levels, specifically at the end date of that planning level. It enables data-driven decision-making and proactive measures to address defects before or during planning level completion.
This page is built using the defect trend by planning level, planning level hierarchy, work item goals, backlog group hierarchy, portfolio item hierarchy, and planning level programs datasets.
Defect Trend by Planning Level
Displays trends of defects across various planning levels. Each bar on this panel represents a single planning level. The height of the bar indicates the number of defects on the last day of the planning level. If the planning level doesn’t reach the end date, the bar represents the total number of defects in that planning level today. The x-axis represents the planning level, and the y-axis represents the defect count. You can hover the cursor over a bar to view details like work item type or priority or status, planning level, and defect count.
Here is a screenshot of the Defect trend by planning level dashboard.
You can filter and view the required data using the following filters:
- Planning level: Displays data of defects in the selected planning level and all child planning levels that belong to the planning level.
- The following filters display filter values based on the filtered planning level.
- The following filters cascade each other except the Planning level start date range filter.
- Program: Displays data on defects in the selected program.
- Backlog group: Displays data of defects in the selected backlog group and child backlog group that belongs to the backlog group.
- Team: Displays data of a specific group of cross-functional members.
- Portfolio item: Displays data of defects in the selected portfolio item and all child portfolio items that belong to the portfolio item.
- Backlog goal: Displays data of defects in the selected backlog goal.
- Defect state: Displays data of defects in any of the following reporting category states: active and closed.
- Planning level start date range: Displays data of a specific date range or period.
- Group by: Displays data of defects in any of the following dimensions: status, priority, and defect type.
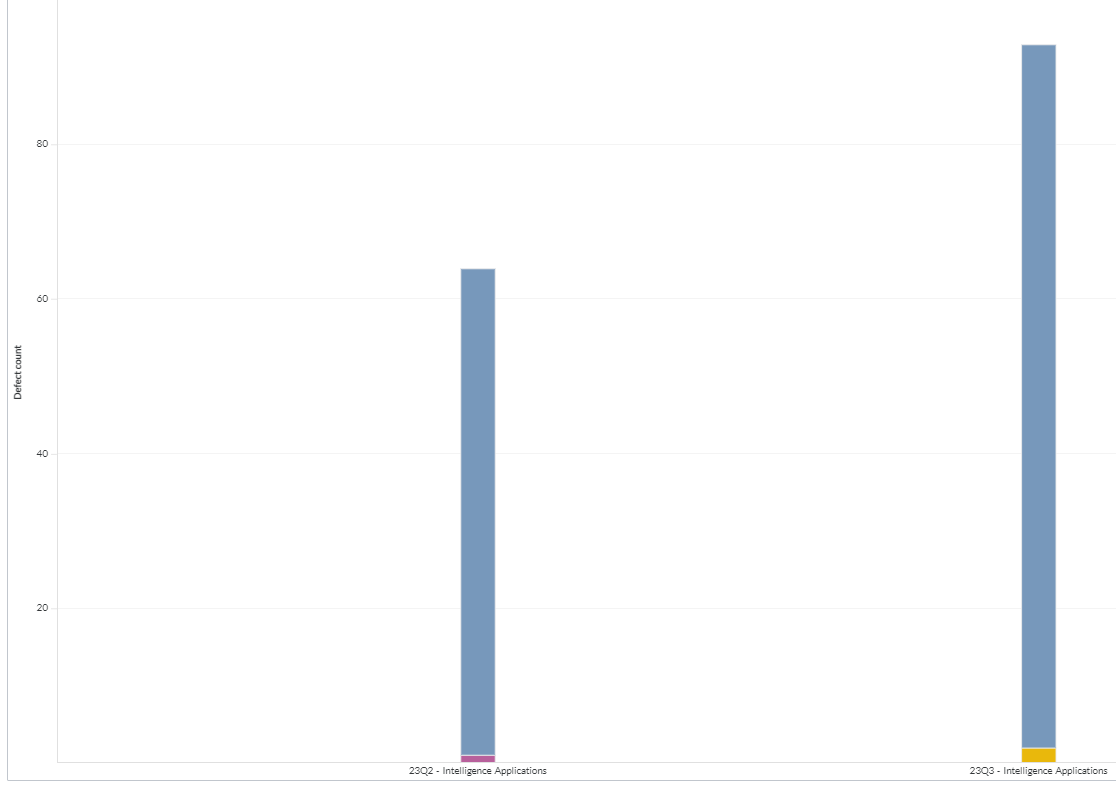
You can use these filters to refine the displayed data. For example, you can choose a program from the Program filter to view the corresponding page. Here is an example program-filtered panel.
Components of dataset used in this page used in this page
The following components of the dataset are used in this page:
Attributes
| Attribute Name | Description | Dataset |
|---|---|---|
| Planning level | Name of the planning level | Defect trend by planning level |
| Type | Type of defect, as in source | Defect trend by planning level |
| Priority | Priority of the defect | Defect trend by planning level |
| Status | Status of the defect as mentioned in the source | Defect trend by planning level |
Metrics
| Metric Name | Description | Dataset |
|---|---|---|
| Defect count | Count of defects at the planning level | Defect trend by planning level |
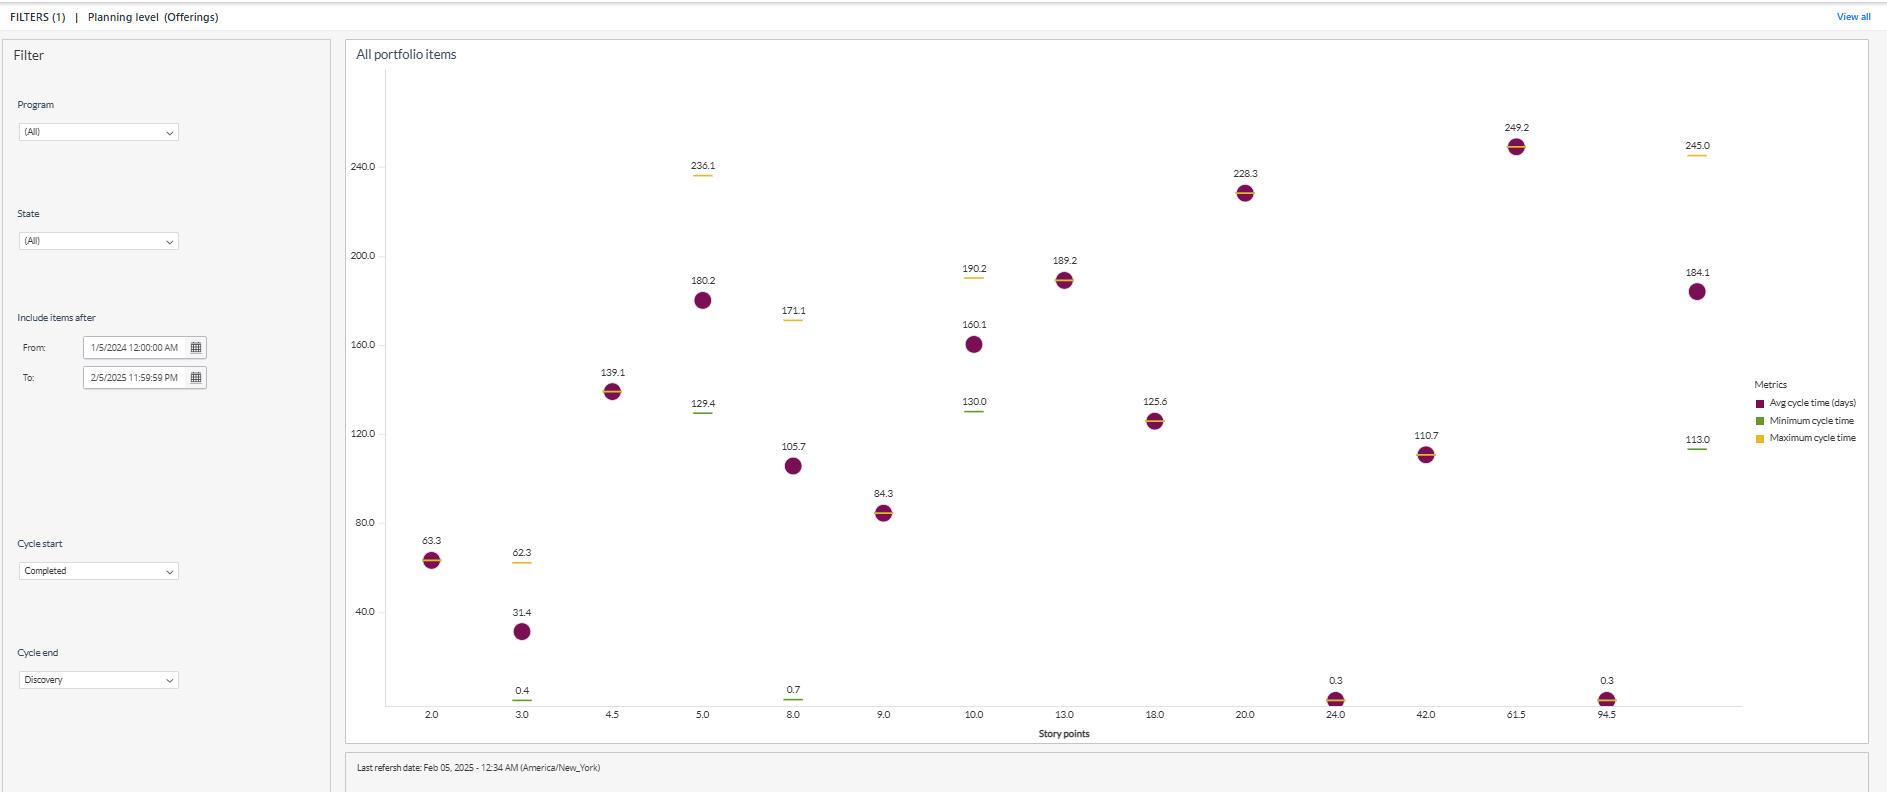
Portfolio Item Cycle Time
The Portfolio item cycle time dashboard provides insights into the time taken for portfolio items to progress through different stages. It helps identify trends, bottlenecks, and areas for improvement in the workflow. You can apply filters to focus on specific data and analyze cycle time variations.
Cycle refers to the duration of a portfolio item to move from the filtered two status like developing to the ready to demo status.
This page is built using the planning level hierarchy, planning level programs, and portfolio item time in status datasets.
Here is a screenshot of the Portfolio item cycle time dashboard.
You can filter and view the required data using the following filters:
- Planning level: Displays data of portfolio items in the selected planning level and all child planning levels that belong to the planning level.
- The following filters display filter values based on the filtered planning level.
- The following filters cascade each other except the Include items after filter.
- Program: Displays data of portfolio items in the selected program.
- Portfolio item state: Displays data of portfolio items in any of the following reporting category states: active and closed.
- Include items after: Displays data of specific date range or period.
- Cycle start: Displays the status of portfolio items that define the beginning of the cycle.
- Cycle end: Displays the status of portfolio items that define the end of the cycle.
If you choose a cycle start range value that is higher than the rank of the cycle end status, the system will automatically swap the selected status values for both options. This ensures consistency and accuracy in defining the cycle range for your analysis.
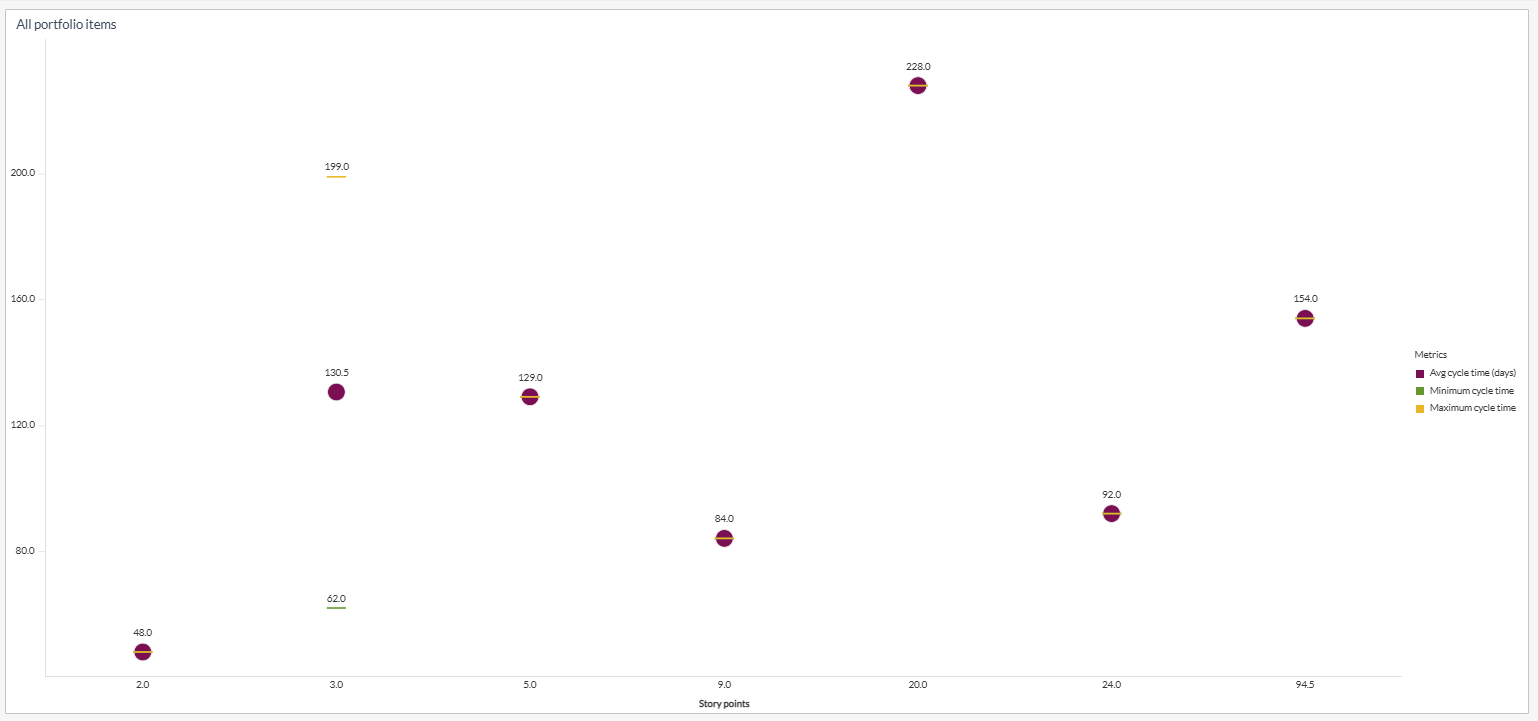
You can use these filters to refine the displayed data. For example, you can choose a program from the Program filter to view the corresponding page. Here is an example program-filtered panel.
All portfolio items
Displays the trend of the portfolio item in cycle time. The scatter plot panel visualizes the cycle time of tracked portfolio items based on total estimate grouping. Each Total Estimate grouping on the scatter plot consists of the following three data points:
- Average cycle time: This data point represents the average time for portfolio items within the total estimate grouping in the chosen cycle.
- Maximum cycle time: This data point indicates the maximum duration of portfolio items within the total estimate grouping in the chosen cycle.
- Minimum cycle time: This data point represents the minimum duration of portfolio items within the total estimate grouping in the chosen cycle.
The x-axis represents the story points and the y-axis represents the minimum, average, and maximum cycle time. You can hover the cursor over the panel to see the story points, portfolio item count, and minimum or average or maximum cycle time.
Components used in this page
The following components of the dataset are used in this page:
Attributes
| Attribute Name | Description | Dataset |
|---|---|---|
| Story points | Story points assigned to the portfolio item | Portfolio item time in status |
Metrics
| Metric Name | Description | Dataset |
|---|---|---|
| Average cycle time | Average duration between work start and work completed for a portfolio item for all the portfolio items in a program | Portfolio item time in status |
| Maximum cycle time | Maximum duration between work start and work completed for a portfolio item for all the portfolio items in a program | Portfolio item time in status |
| Minimum cycle time | Minimum duration between work start and work completed for a portfolio item for all the portfolio items in a program | Portfolio item time in status |
| Portfolio item count | Count of portfolio items in a program | Portfolio item time in status |
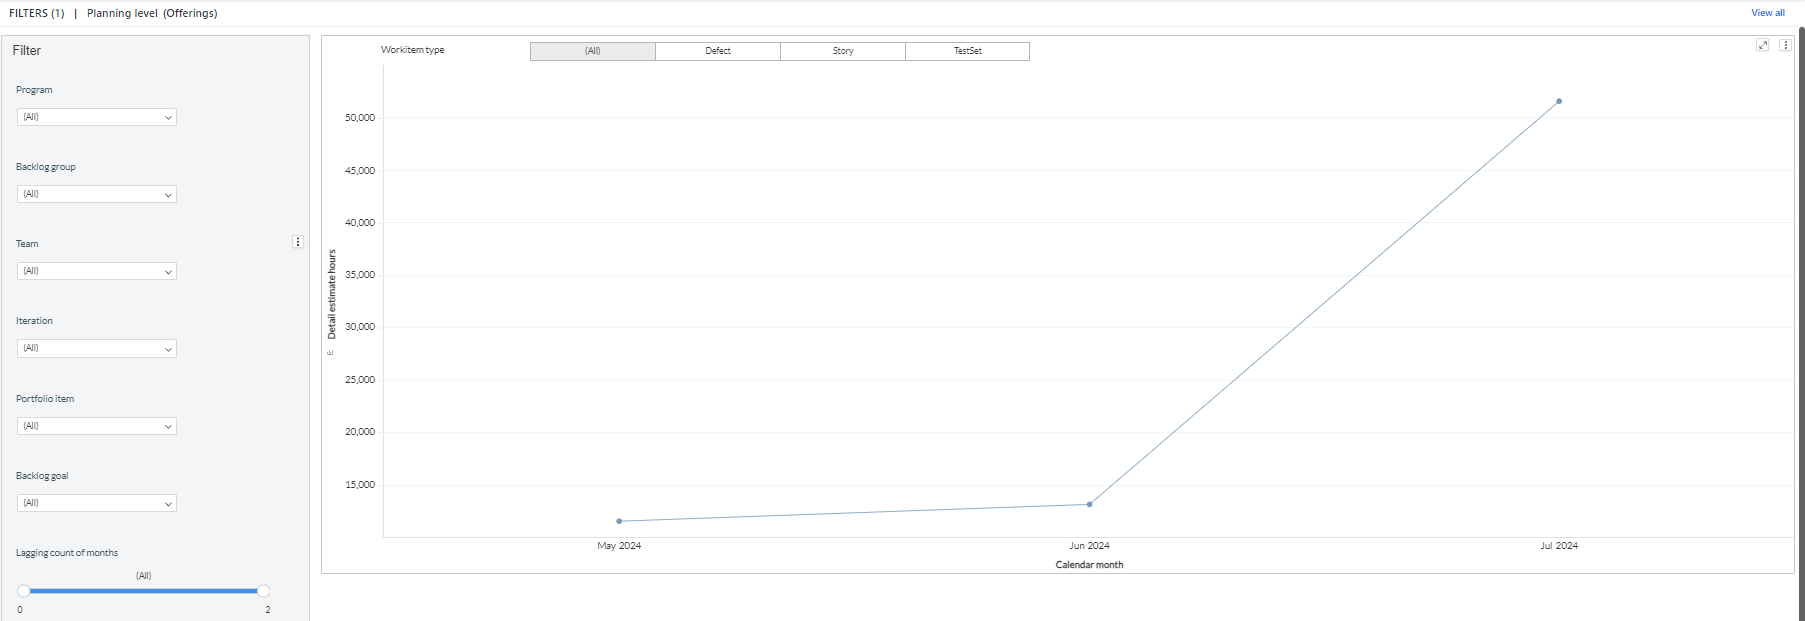
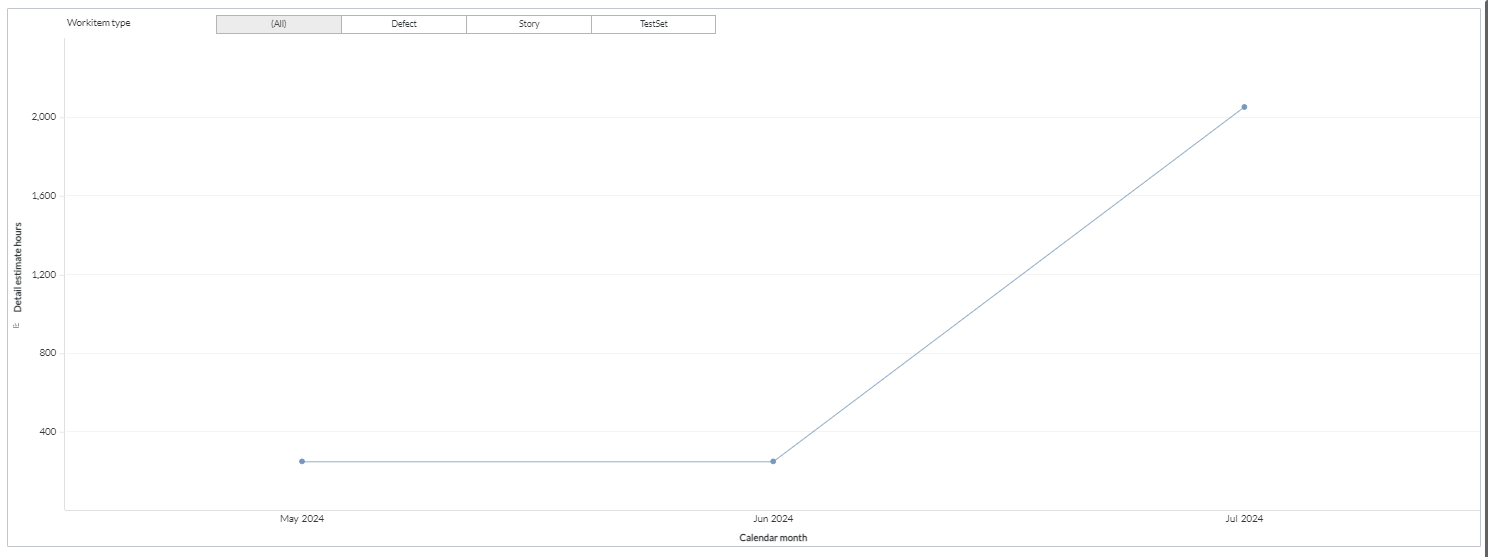
Detail Estimate Trend
The Detail Estimate Trend page enables you to understand the trend of detail estimate of a planning level or program over time. Detail estimate trend analysis involves tracking and monitoring the effort needed to resolve defects over time. You can evaluate the progress and effectiveness of your defect fixing and identify any unusual defects.
This page is built using the work item snapshot monthly, planning level hierarchy, work item goals, backlog group hierarchy, portfolio item hierarchy, and planning level programs datasets.
Detail Estimate Trend
Displays trend of detail estimate. Each data point on the panel represents the total detail estimate value for a given date. Using the Work item type filter, you can view the detail estimate based on different work item types like defect, story, and test set. The x-axis represents the date, and the y-axis represents the detail estimate count. You can hover the cursor over the panel to see the calendar date and detailed estimate.
Here is a screenshot of the Detail estimate trend dashboard.
You can filter and view the required data using the following filters:
- Planning level: Displays data of work items in the selected planning level and all child planning levels that belong to the planning level.
- The following filters display filter values based on the filtered planning level.
- The following filters cascade each other except the Start date, Duration, and Work item type filters.
- Program: Displays data of work items in the selected program.
- Team: Displays data of a specific group of cross-functional members.
- Backlog group: Displays data of work items in the selected backlog group and child backlog group that belongs to the backlog group.
- Iteration: Displays data of a specific planning period for an Agile team.
- Portfolio item: Displays data of work items in the selected portfolio item and all child portfolio items that belong to the portfolio item.
- Backlog goal: Displays data of work items assigned to the selected backlog goals.
- Start date: Displays data of work items in the selected start date.
- Duration: Displays data of work items in the selected duration types like 50 days, 20 weeks, and 10 months.
- Work item type: Displays data of work items in the following work item types: defect, story, and test set.
You can use these filters to refine the displayed data. For example, you can choose a team from the Team filter to view the corresponding detail estimate trend page. Here is an example team-filtered panel.
Components of dataset used in this page used in this page
The following components of the dataset are used in this page:
Attributes
| Attribute Name | Description | Dataset |
|---|---|---|
| Calendar date | Gregorian calendar date displayed in the format 'D/M/YYYY' | Workitem snapshot monthly |
Metrics
| Metric Name | Description | Dataset |
|---|---|---|
| Detail Estimate | Summation of all estimate points of the backlog item in the iteration | Workitem snapshot monthly |