Workflow Analytics Dashboard
Workflows are step-by-step interactive sessions designed to accelerate developers' familiarity with internal tools and streamline the onboarding of applications and environments. These guided workflows prompt users for inputs and automatically generate necessary artifacts, facilitating release orchestration and end-to-end deployment. Workflows minimize the need for in-depth tool knowledge, allowing developers to focus on their core tasks. They serve as repeatable paths for addressing various engineering needs, ensuring efficiency, consistency, and ease of use throughout the development and deployment lifecycle.
Analyzing workflow usage details is crucial for process improvement as it allows Platform engineering teams to identify bottlenecks, inefficiencies, and areas of improvement within their workflows. By understanding the specific metrics and patterns associated with each workflow and its workflow category, teams can make data-driven decisions to optimize their processes, increase productivity, and reduce errors.
This dashboard will help you answer some of the following business scenarios:
- How has the growth of the onboarding process evolved over time?
- Which workflows are completed most often, and which ones are frequently started but abandoned by users?
- What is the adoption rate and average execution time of workflows?
Dashboard Filters
Dashboard filters are used to apply globally across all the panels or widgets on a dashboard.
- Folder: Displays data about a specific folder within which workflow executions are organized.
- User: Displays data of an individual executing the workflows.
- Tags: Displays data associated with specific labels or keywords that classify workflows according to their characteristics.
- Start date: Displays data about a specific date range and time period. By default, the data is displayed for the last 30 days. From: The from filter allows you to include the beginning or starting date of the time period to analyze. To: The to filter allows you to include the end or closing date of the time period to analyze.
- Team: Displays data about a group who work together to achieve a shared goal or task.
- Workflow category: Displays data about a specific classification of workflow, as well as the associated workflow. Note: Each workflow may be assigned to one or more categories based on its characteristics.
- Status: Displays data about a specific state of the workflow. For example, you can choose completed to view data related to successful workflows or in-progress to view data related to ongoing workflows.
Panel Filters
Panel filters are used to filter a particular panel or visualization on the dashboard.
- Sort by: Displays data about the highest or lowest number of workflows that have been executed or the highest or lowest percentage of workflows that have been successfully completed. For example, choosing the highest and assigning a value 10, provides you with the top ten most executed workflows and vice versa.
This dashboard is built using workflow_details, workflow_category_details, workflow_teams, workflow_tag_details, and workflow_users_details datasets.
KPIs
-
Successful Executions: Displays the number of successful workflow executions.
-
Successful Executions %: Displays the percentage of successful workflow executions.
-
Failed Executions: Displays the number of failed workflow executions.
-
Failed Executions %: Displays the percentage of failed workflow executions.
-
Workflow adoption rate (%): Displays the percentage of active users executing workflows when compared to total users.
-
Licensed Users: Displays the total number of authenticated users.
Note: Data displayed for all KPIs except Licensed users is for the last 30 days by default, and changes based on the Start date filter.
Workflow Executions Overview by Category
This section is focused on workflow insights, classified by their respective categories. The insights offered here are designed to provide you with a comprehensive overview of workflow details, facilitating efficient analysis. Organizing insights into specific categories allows you to quickly identify the highest or lowest used workflow category and its associated workflow in terms of execution and completion. You can click on a particular workflow category to drill down and view details such as workflow name, release folder name, workflow status, workflow completion date, number of times the workflow is being executed, number of users, number of teams, percentage of successful workflow execution, and percentage of failed workflow execution.
Selection of a category from this panel drives the data of the Executions and Users panel.
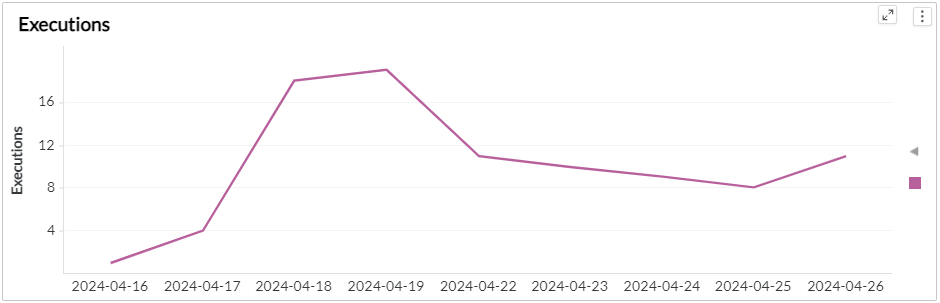
Executions
This section displays the trend of workflow executions classified by their respective categories, which explains how workflow executions change over time. Understanding the changes in workflow executions over time is crucial for identifying patterns and making data-driven decisions to improve efficiency and productivity. The X-axis represents the execution count, and the Y-axis represents the day or week or month based on the time period you choose. You can hover over the graph to get the workflow category, day or week or month, and execution count details.
By default, execution details of all workflow categories are displayed, but selecting a specific category displays information relevant to that category.
Users
This section displays the trend of users classified by workflow categories. Analyzing this trend can provide valuable insights into user behavior and preferences over time. It can help identify patterns, such as peak usage periods or fluctuations in user engagement, which can inform product development and resource allocation. The X-axis represents the user and the Y-axis represents the day or week or month based on the time period you choose. You can hover over the graph to get the workflow category, day or week or month, and execution count details.
By default, user details of all workflow categories are displayed, but selecting a specific category displays information relevant to that category.

Workflow adoption
This section displays details of the extent to which a team or users are using a particular workflow and provides a holistic view of workflow adoption, enabling organizations to optimize their processes and ensure effective utilization of their workflow. You can drill down to details such as team and user details to understand who is utilizing workflows, completed dates to analyze the trend, successful executions to know the reliability and efficiency, failed executions for improvement and troubleshooting, executions to know how often workflows are being utilized, and number of different workflows executed.
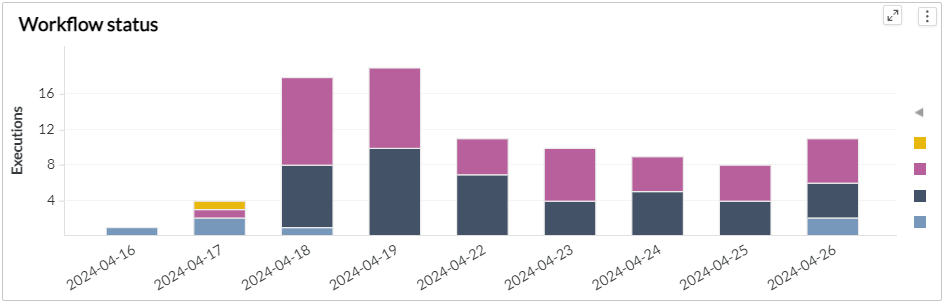
Workflow Status
This panel displays a vertical bar graph showing the data of the count of executions for various workflow statuses. Using this section, you can view the number of workflows associated with a specific status such as in progress, failed, completed, and aborted. A growing trend of successful executions indicates a smooth and efficient workflow. However, if the number of failed executions rises, it suggests that underlying errors must be addressed. You can hover over a vertical bar to view the status, start date, and count of executions.
Workflow Duration
This section helps you track the execution duration of each workflow, enabling you to identify which workflows take longer to execute and may need improvement. You can drill down details such as workflow category, workflow name, release folder, workflow status, number of executions, and average execution duration in minutes.
Tracking the execution duration details for each workflow helps identify which workflows take longer to execute and could be improved.
Usage trend
This section provides you with a comprehensive view of user engagement, team involvement, and overall activity levels and helps you identify any fluctuations in usage. You can drill down details such as username, team name, total number of executions, executions in last 30 days, executions in previous 30 days, and usage difference between the last 30 days and the previous 30 days.
Components used in this dashboard
This section lists all the attributes and metrics used to build the reports in this dashboard.
Attributes
| Attribute | Description |
|---|---|
| Completed Date | Date and time when the Workflow was closed |
| Folder | Name of the Folders within which Releases are Organized |
| Lagging count of 30 days period | Count of the number of days in a 30-day period since the first data record to the present |
| Release Owner | The owner of the of the release |
| Workflow | Workflows are a combination of tasks that can be carried out interactively |
| Workflow category | Category to which the workflow belongs |
| Workflow completed date | Date and time when the Workflow was closed |
| Workflow start date | Date and time when the Workflow was created |
| Workflow status | Current status of the workflow |
| Workflow Team Name | Name of the group consisting of individuals who work together collaboratively on a workflow |
Metrics
| Metric | Description |
|---|---|
| Avg execution duration | Average amount of time it takes for execution of workflow |
| Executions | The total number of times the task is performed |
| Executions in Last 30 days | The number of times the task is performed in the last 30 days |
| Executions in Last 60 to 30 days | The number of times the task is performed in the last 60 to 30 days |
| Failed Executions | The number of times the task is unsuccessful |
| Failed Executions % | Percentage of workflows that are unsuccessful, out of total workflows created |
| Licensed Users | Individuals who have been granted authorization to execute a workflow |
| No different workflows executed | Count of different workflows performed |
| Successful executions | The number of times the task is successful |
| Successful executions % | Percentage of workflows that are successful, out of total workflows created |
| Teams | Team name responsible for executing workflows |
| Users | Individuals running the workflows |
| Workflow adoption rate | The rate at which users are adopting the workflow |
| Workflow execution diff | The change in the number of executions between the last 30 days and the previous 30 days |