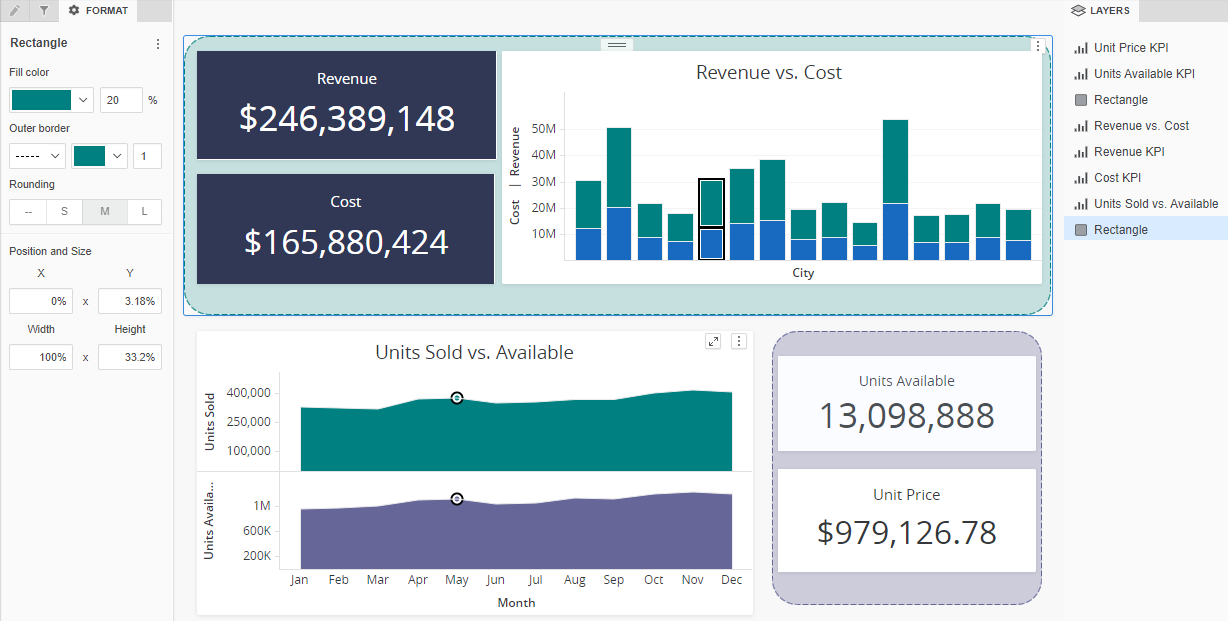
Add Shapes
Use shapes in your dashboard to help frame a visualization, create a layered effect, or visually group elements together.
-
Open a new or existing dashboard.
-
In the top toolbar, click Shape
 .
. -
Select a shape:
- Line
- Rectangle
- Ellipse
- Triangle
- Polygon
-
Click and drag where you want the shape to appear.
Info: If a shape overlaps another container, you can resize and reposition it by right-clicking on its layer and selecting Hide on Default View from the Layers panel.
-
Use the options in the Format panel to customize your shape.