Device Usage Dashboard
The Device Usage dashboard offers comprehensive insights into device reservation and utilization tailored to projects. It provides visibility into optimal license usage to maximize mobile device efficiency and achieve higher ROI. This dashboard enables in-depth analysis of reservation details for physical devices, including scheduled durations, at both user and project levels, facilitating thorough evaluation of device utilization.
As an admin, you can use this dashboard to understand the following business scenarios:
- How much time is a device reserved (in use status) without an active session per project and user?
- Is there any device that is not used for any tests in my cloud? Should I encourage my tester to test or replace it with another device?
- Is there any device that is used for many tests in my cloud? Should I add more devices with this model/version?
- What kind of test is run for each project in the cloud?
- What is the trend of my license usage in the cloud?
The Device Usage dashboard is built using reservation details, session details, and ct security dataset datasets.
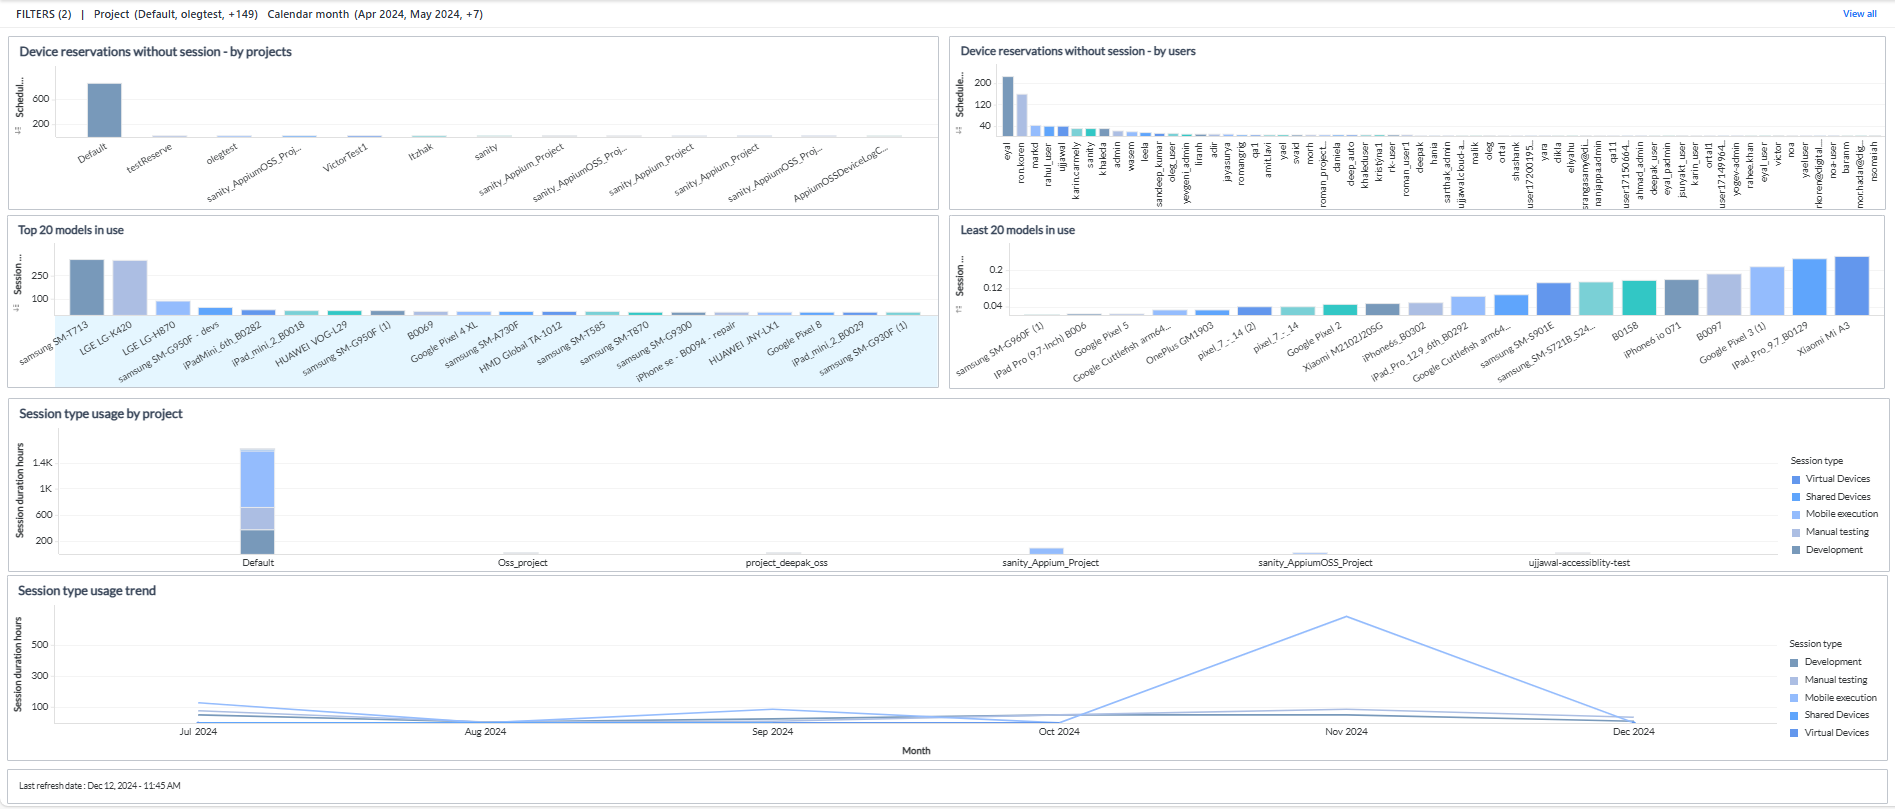
Here is the screenshot of device usage dashboard.
You can filter and view the required data using the following filters:
- Project: Displays data of device usage in the selected project.
- Calendar Date: Displays data of a specific date range or period.
- Calendar Month: Displays data of device usage in the selected month.
You can use these filters to refine the displayed data. For example, you can choose a duration from the Date filter to see the corresponding dashboard. Here is an example date-filtered panel.
Device Reservations without Sessions - By Projects
This panel displays a bar graph representing the top 10 projects that made the most reservations duration without a session on the x-axis and the scheduled duration in hours on the y-axis. The magnitude of vertical bars indicates the duration of device reservation done for a particular project and not used. A pop-up appears when you hover over the bar of a particular project that displays the name of the reservation project and the scheduled duration in hours. When you click a specific project in the panel, you will see the user who created the most reservations without sessions.
The data displayed in this panel is based on the Environment and Date filter applied.
Device Reservations without Sessions - By Users
This panel displays a bar graph representing the top 10 users that made the most reservations duration without a session on the x-axis and the scheduled duration in hours on the y-axis. The magnitude of vertical bars indicates the duration of device reservation done by a particular user and not used. A pop-up appears when you hover over the bar of a user that displays the username and the scheduled duration in hours.
The data displayed in this panel is based on the Environment and Date filter applied.
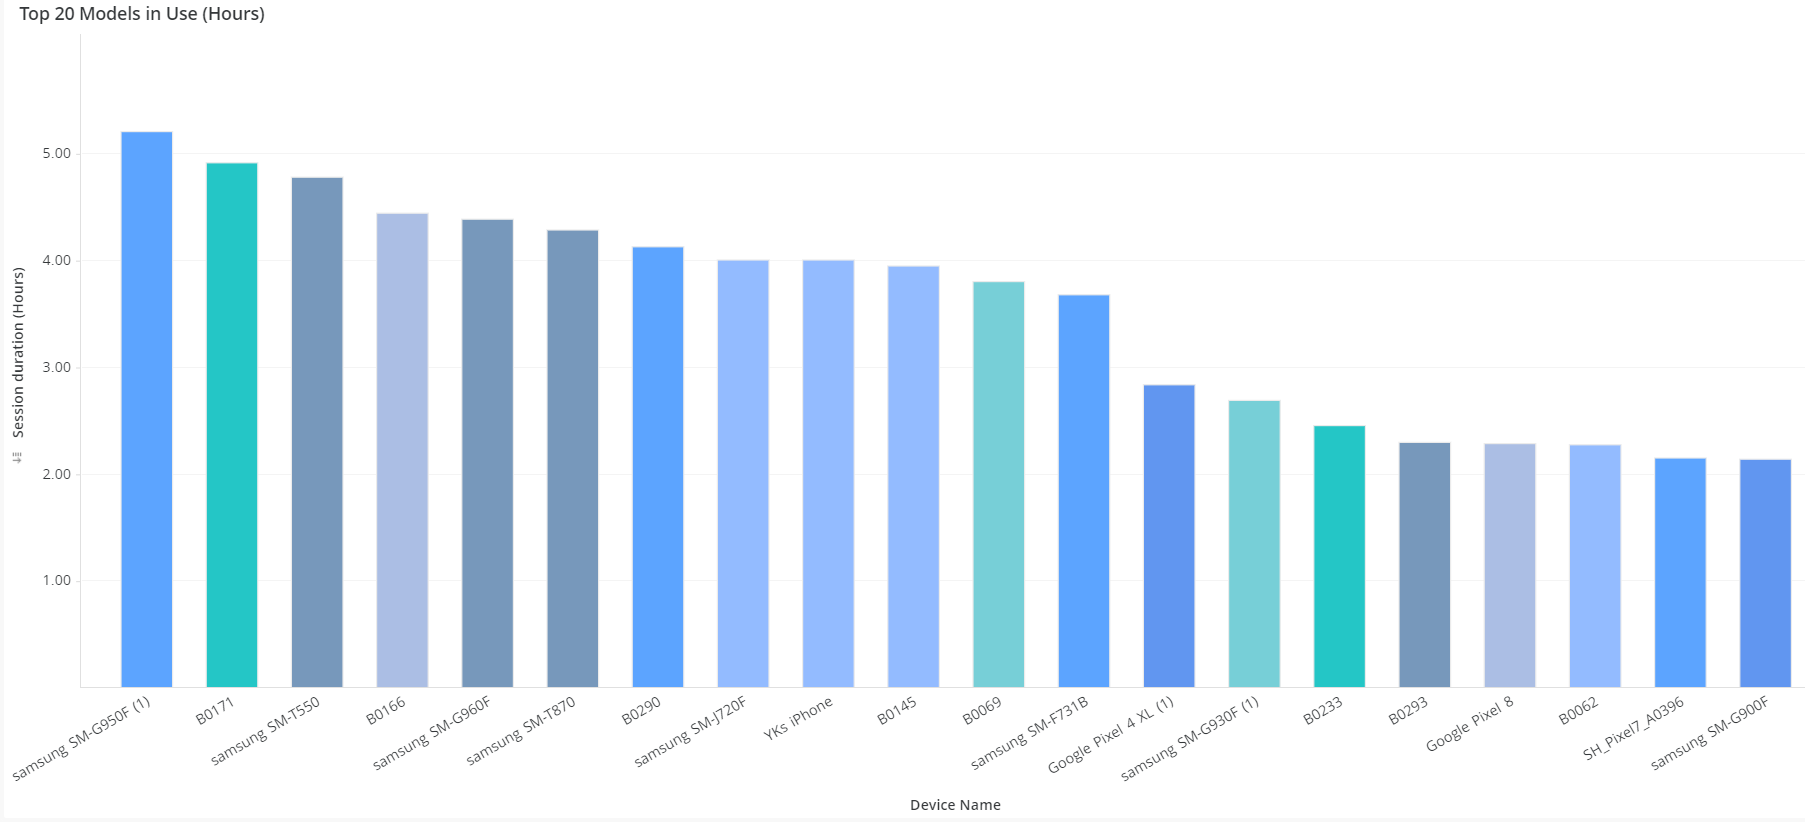
Top 20 Models in Use
This panel displays a bar graph representing the top 20 devices based on their device name on the x-axis and session duration in hours on the y-axis. The magnitude of vertical bars indicates the duration of device usage. A pop-up appears when you hover over the bar of a particular device that displays the name of the device and session duration in hours.
The data displayed in this panel is based on the Environment and Date filter applied.
Least 20 Models in Use
This panel displays a bar graph representing at least 20 devices based on their device name on the x-axis and session duration in hours on the y-axis. The magnitude of vertical bars indicates the duration of device usage. A pop-up appears when you hover over the bar of a particular device that displays the name of the device and session duration in hours.
The data displayed in this panel is based on the Environment and Date filter applied.
Session Type Usage by Project
This panel displays a bar graph categorized based on the Project and details of sessions used by each project categorized by session type. The x-axis represents the project for which the session is made, and the y-axis represents the duration of the session in hours. A pop-up appears when you hover over the bar of a session type and displays details, such as the name of the session type, name of the project reserved, duration of a session, and percentage of session type used by the project.
The data displayed in this panel is based on the Environment and Date filter applied.
Session Type Usage Trend
This panel displays a line graph representing the trend of session types used across calendar months. The x-axis represents the calendar month, and the y-axis represents the duration of the session in hours. A pop-up appears when you hover over the line for a particular month and displays details, such as the name of the session type, the name of the calendar month, and the duration of the session used.
The data displayed in this panel is from the last six months.
Components of dataset
The following components of the dataset are used in this dashboard:
Attributes
| Attribute Name | Description | Dataset |
|---|---|---|
| Calendar month | Gregorian calendar month displayed in the format 'Mon YYYY' | Session details |
| Device | Name of the device, such as iPad Air or Galaxy S5 | Session details |
| Session type | License type of the session | Session details |
| Project | Name of the project | Reservation details |
| Reservation project | The project for which the device is reserved | Reservation details |
| Reserved by | The project or user who reserved the device | Reservation details |
Metrics
| Metric Name | Description | Dataset |
|---|---|---|
| Scheduled duration (hours) | Time duration between Scheduled Reservation Start Date to Scheduled Reservation End Date in hours | Reservation details |
| Session duration (hours) | Time duration between Session created to session closed time in hours | Session details |