Test Execution Dashboard
The Test Execution dashboard provides a detailed view of test execution trends and execution status across the applications, devices, and versions. The dashboard delivers significant insights into the utilization and performance of execution devices and exhibits the trend of successful and failed test execution rates. With these insights, you can identify the gaps in continuous testing, gauge the device or version crash rate, and mitigate those to facilitate the continuous delivery process.
The dashboard supports the last six months' test execution summary with the Continuous Testing source that allows you to remotely test multiple versions of the physical devices in the cloud.
As a Quality Assurance Manager, you can use this dashboard to understand the following business scenarios:
- View the trend of test executions across the test application platform
- View the test execution status by devices and the execution report details
- Understand the test execution overview at various application levels and the test device execution details
Primary View
This panel provides different tabs to switch and analyze data. The following are the tabs provided:
- Application Build Version: Tab for analyzing test execution data related to the build version.
- Application Release Version: Tab for analyzing test execution data related to the release version.
- Calendar Month: Tab for analyzing test execution data for a particular month.
- Application Platform: Tab for analyzing test execution data based on the selected platform (ANDROID or iOS), helping to compare and isolate results across mobile operating systems.
Selection of any tab drives the data in the KPIs and Pass/Fail by Primary Metric panels.
KPIs
- No. of Test Executions: Displays the number of test executions run across all build versions, release versions or a calendar month.
- % Failed Test Executions: Displays the percentage of failed test executions across build versions, release versions or a calendar month.
Here is the screenshot of the Test execution dashboard.
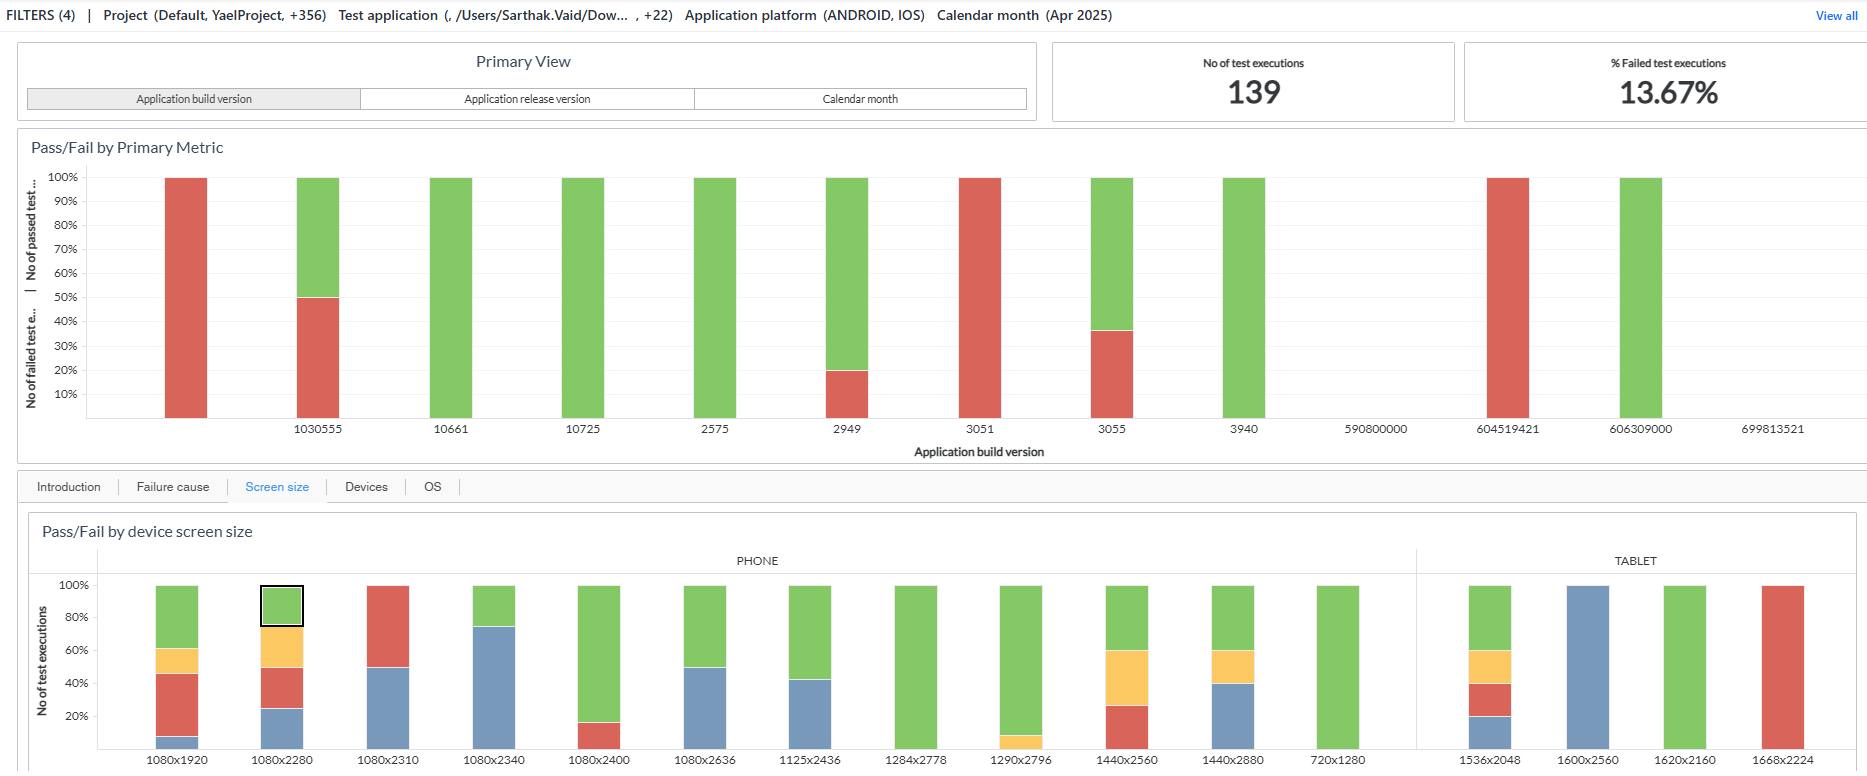
You can filter and view the required data using the following filters:
- Project: Displays data of test execution in the selected project.
- Calendar date: Displays data of a specific date range or period.
- Calendar month: Displays data of test execution in the selected month.
- Test application: Displays data of test execution in the selected test application name.
- Application platform: Tab for analyzing test execution data based on the selected platform (ANDROID or iOS), helping to compare and isolate results across mobile operating systems.
You can use these filters to refine the displayed data. For example, you can choose a month from the Month filter to see the dashboard for that month. Here is an example filtered panel.
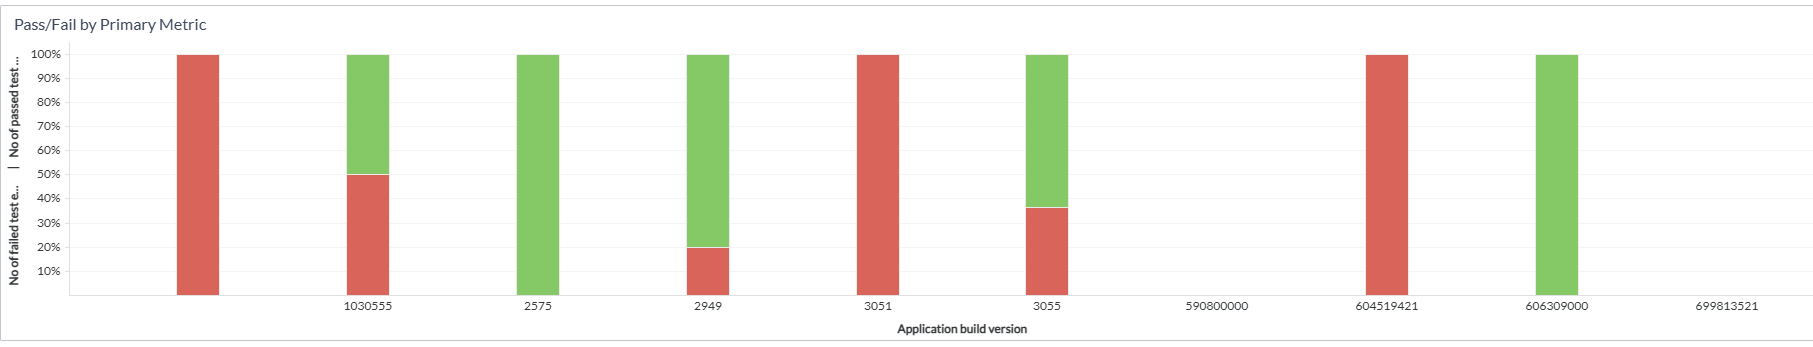
Pass/Fail by Primary Metric
This panel displays a bar graph representing different build versions, release versions, or calendar months. A pop-up appears when you hover over the bar of the build version or release version bar and displays information, such as the application build version, the number of passed or failed tests, and the percentage of passed or failed tests. For a Calendar Month, the pop-up displays' information, such as the name of a calendar month, the number of failed or passed test executions, and the percentage of passed or failed.
A test that has passed or failed is visually illustrated using green or red colors, along with its magnitude. Selection of any category from this section drives data in the following sections.
Note: Primary metric drives all the following panels.
Introduction
This panel provides additional information on how to use the dashboard and descriptions of metrics and attributes used in the dashboard.
Failure Cause
This panel displays the details of failure and is categorized based on the cause of a failure. You can click on a failure category to analyze test details, such as the date on which the test failure occurred, the name of the test failure, the status of the test, the name of the application platform, and the cause of the test failure.
Screen Size
This panel displays the details of test execution based on device screen sizes and is categorized on the same. You can click on a category to analyze details, such as the date on which the test occurred, the name of the test, the status of the test, the name of the application platform, and the cause of the test failure.
Devices
This panel displays the test execution details based on device and device manufacturer and is categorized on the same. You can click on a category to analyze details, such as the date on which the test occurred, the name of the test, the status of the test, the name of the application platform, and the cause of the test failure.
OS
This panel displays the details of test execution based on operating systems and is categorized based on devices used for an operating system. A pop-up appears when you hover over the bar of a device category and displays details, such as the name of the operating system, the status of the test, the name of the test device manufacturer, the number of passed or failed tests, and percentage of passed or failed tests. You can click on a category to analyze details, such as the date on which the test occurred, the name of the test, the status of the test, the name of the application platform, and the cause of the test failure.
Components of dataset
The following components of the dataset are used in this dashboard:
Attributes
| Attribute Name | Description | Dataset |
|---|---|---|
| Application build version | The build version of the test application | Test execution details |
| Application platform name | Name of the mobile platform | Test execution details |
| Application release version | The release version of the test application | Test execution details |
| Calendar month | Gregorian calendar date displayed in the format ‘D/M/YYYY’ | Test execution details |
| Date | Gregorian calendar date displayed in the format ' YYYY' | Test execution details |
| Device name | Name of the device, such as iPad Air or Galaxy S5 | Test execution details |
| Month | Gregorian calendar month displayed in the format 'Mon YYYY' | Test execution details |
| Report URL | Combination of test url and name | Test execution details |
| Status | Current status of the test execution | Test execution details |
| Test execution status | Current status of the test execution | Test execution details |
| Test device category | Category of the test device, such as Phone or Tablet | Test execution details |
| Test device manufacturer | Manufacturer of the device on which the test is run | Test execution details |
| Test device model | Model of the device on which the test is run | Test execution details |
| Test device OS | Operating system version of the device on which the test is run | Test execution details |
| Test device screensize | Screen size of the device on which the test is run | Test execution details |
| Test execution cause | Root cause for the test execution failure | Test execution details |
Metrics
| Metric Name | Description | Formula | Dataset |
|---|---|---|---|
| % Failed test executions | % of test executions that are failed, out of total test executions created. | [No of failed test executions]/[No of test executions] | Test execution details |
| No. of failed test executions | Count of test executions that have failed | Count (Failed test executions) | Test execution details |
| No. of passed test executions | Count of test executions that have passed | Count (Passed test executions) | Test execution details |
| No. of test executions | Total count of test executions | Count(Test number) | Test execution details |