SeeTest Client - GetMonitorsData
Please note that this tool is classified as a Legacy tool. We recommend transitioning to our updated solutions to maintain optimal performance and security in your workflows. For more information on this matter, please reach out to technical support .
String getMonitorsData(csvFilePath)
Description
Return the content of the monitor values as string in CSV format.
Parameters
- CSV File Path (optional): The absolute path for the file. Path must include the file name with *.csv. If value is blank, it will store the file in the report folder.
Note: When running the command, counter monitoring is on hold.
Usage
Command retrieves all Counter values which were collected during the test run so far.
Scenario: We will create a test on the EriBank demo application. During the test run, we will monitor the memory values of the application. At the end of the test, we will collect all counter values using this command
Parameters:
- csvFilePath (optional): Will be blank.

Result: The generated CSV file.
In this case, there are two columns. Date value was take and the value measured.
Energy Monitor Data
With Energy monitoring, additional lines are added to the output. Examples:
iOS
When running the following test:
Energy monitor Safari when a page is loaded
client.launch("com.apple.mobilesafari", false, false);
client.startMonitor("com.apple.mobilesafari:battery");
client.launch("http://en.wikipedia.org/wiki/Electric_energy_consumption", false, false);
String monitoringDataAsCsv = client.getMonitorsData("");
you may get an output similar to the following. From this data, we can see that energy was consumed on networking.
Android
Running the following script:
Energy monitor Chrome when a page is loaded
client.startMonitor("com.android.chrome:battery");
client.launch("chrome:www.wikipedia.com", true, true);
client.sleep(10000);
String str0 = client.getMonitorsData("");
Retrieved the following energy data in a csv file:
com.android.chrome
<br/><br/>Date<br/><br/> | <br/><br/>cpu_power_use<br/><br/> | <br/><br/>wifi_power_use<br/><br/> | <br/><br/>gpu_power_use<br/><br/> | <br/><br/>rest_power_use<br/><br/> | <br/><br/>total_power_use<br/><br/> | <br/><br/>screen_power_use<br/><br/> |
|---|---|---|---|---|---|---|
<br/><br/>2018.03.22 05:14:37 IST<br/><br/> | <br/><br/>0<br/><br/> | <br/><br/>N/A<br/><br/> | <br/><br/>N/A<br/><br/> | <br/><br/>0<br/><br/> | <br/><br/>0<br/><br/> | <br/><br/>0.055939499621<br/><br/> |
<br/><br/>2018.03.22 05:14:38 IST<br/><br/> | <br/><br/>0.0135<br/><br/> | <br/><br/>N/A<br/><br/> | <br/><br/>N/A<br/><br/> | <br/><br/>0<br/><br/> | <br/><br/>0.0135<br/><br/> | <br/><br/>0.091759716717<br/><br/> |
<br/><br/>2018.03.22 05:14:39 IST<br/><br/> | <br/><br/>0.0168<br/><br/> | <br/><br/>N/A<br/><br/> | <br/><br/>N/A<br/><br/> | <br/><br/>0<br/><br/> | <br/><br/>0.0168<br/><br/> | <br/><br/>0.116759716717<br/><br/> |
<br/><br/>2018.03.22 05:14:40 IST<br/><br/> | <br/><br/>0.0173<br/><br/> | <br/><br/>N/A<br/><br/> | <br/><br/>N/A<br/><br/> | <br/><br/>0<br/><br/> | <br/><br/>0.0173<br/><br/> | <br/><br/>0.141759716717<br/><br/> |
<br/><br/>2018.03.22 05:14:41 IST<br/><br/> | <br/><br/>0.0184<br/><br/> | <br/><br/>N/A<br/><br/> | <br/><br/>N/A<br/><br/> | <br/><br/>0<br/><br/> | <br/><br/>0.0184<br/><br/> | <br/><br/>0.167759716717<br/><br/> |
<br/><br/>2018.03.22 05:14:43 IST<br/><br/> | <br/><br/>0.0205<br/><br/> | <br/><br/>N/A<br/><br/> | <br/><br/>N/A<br/><br/> | <br/><br/>0<br/><br/> | <br/><br/>0.0205<br/><br/> | <br/><br/>0.204759716717<br/><br/> |
<br/><br/>2018.03.22 05:14:44 IST<br/><br/> | <br/><br/>0.0571<br/><br/> | <br/><br/>N/A<br/><br/> | <br/><br/>N/A<br/><br/> | <br/><br/>0<br/><br/> | <br/><br/>0.0571<br/><br/> | <br/><br/>0.233759716717<br/><br/> |
<br/><br/>2018.03.22 05:14:45 IST<br/><br/> | <br/><br/>0.0833<br/><br/> | <br/><br/>N/A<br/><br/> | <br/><br/>N/A<br/><br/> | <br/><br/>0<br/><br/> | <br/><br/>0.0833<br/><br/> | <br/><br/>0.257759716717<br/><br/> |
<br/><br/>2018.03.22 05:14:46 IST<br/><br/> | <br/><br/>0.0851<br/><br/> | <br/><br/>N/A<br/><br/> | <br/><br/>N/A<br/><br/> | <br/><br/>0<br/><br/> | <br/><br/>0.0851<br/><br/> | <br/><br/>0.281759716717<br/><br/> |
<br/><br/>2018.03.22 05:14:47 IST<br/><br/> | <br/><br/>0.0997<br/><br/> | <br/><br/>N/A<br/><br/> | <br/><br/>N/A<br/><br/> | <br/><br/>0<br/><br/> | <br/><br/>0.0997<br/><br/> | <br/><br/>0.321759716717<br/><br/> |
<br/><br/>2018.03.22 05:14:49 IST<br/><br/> | <br/><br/>0.103<br/><br/> | <br/><br/>N/A<br/><br/> | <br/><br/>N/A<br/><br/> | <br/><br/>0<br/><br/> | <br/><br/>0.103<br/><br/> | <br/><br/>0.353759716717<br/><br/> |
<br/><br/>2018.03.22 05:14:50 IST<br/><br/> | <br/><br/>0.119<br/><br/> | <br/><br/>N/A<br/><br/> | <br/><br/>N/A<br/><br/> | <br/><br/>0<br/><br/> | <br/><br/>0.119<br/><br/> | <br/><br/>0.389759716717<br/><br/> |
<br/><br/>2018.03.22 05:14:51 IST<br/><br/> | <br/><br/>0.136<br/><br/> | <br/><br/>N/A<br/><br/> | <br/><br/>N/A<br/><br/> | <br/><br/>0<br/><br/> | <br/><br/>0.136<br/><br/> | <br/><br/>0.414759716717<br/><br/> |
<br/><br/>2018.03.22 05:14:52 IST<br/> | <br/><br/>0.142<br/><br/> | <br/><br/>N/A<br/><br/> | <br/><br/>N/A<br/><br/> | <br/><br/>0<br/><br/> | <br/><br/>0.142<br/><br/> | <br/><br/>0.438759716717<br/><br/> |
<br/><br/>2018.03.22 05:14:53 IST<br/><br/> | <br/><br/>0.15<br/><br/> | <br/><br/>N/A<br/><br/> | <br/><br/>N/A<br/><br/> | <br/><br/>0<br/><br/> | <br/><br/>0.15<br/><br/> | <br/><br/>0.471759716717<br/><br/> |
<br/><br/>2018.03.22 05:14:54 IST<br/><br/> | <br/><br/>0.153<br/><br/> | <br/><br/>N/A<br/><br/> | <br/><br/>N/A<br/><br/> | <br/><br/>0<br/><br/> | <br/><br/>0.153<br/><br/> | <br/><br/>0.497759716717<br/><br/> |
Each row is the accumulated energy drain to this point from the start of the run.
The link to the .csv files is also attached in the reports as below

Convert the monitoring data to a graph
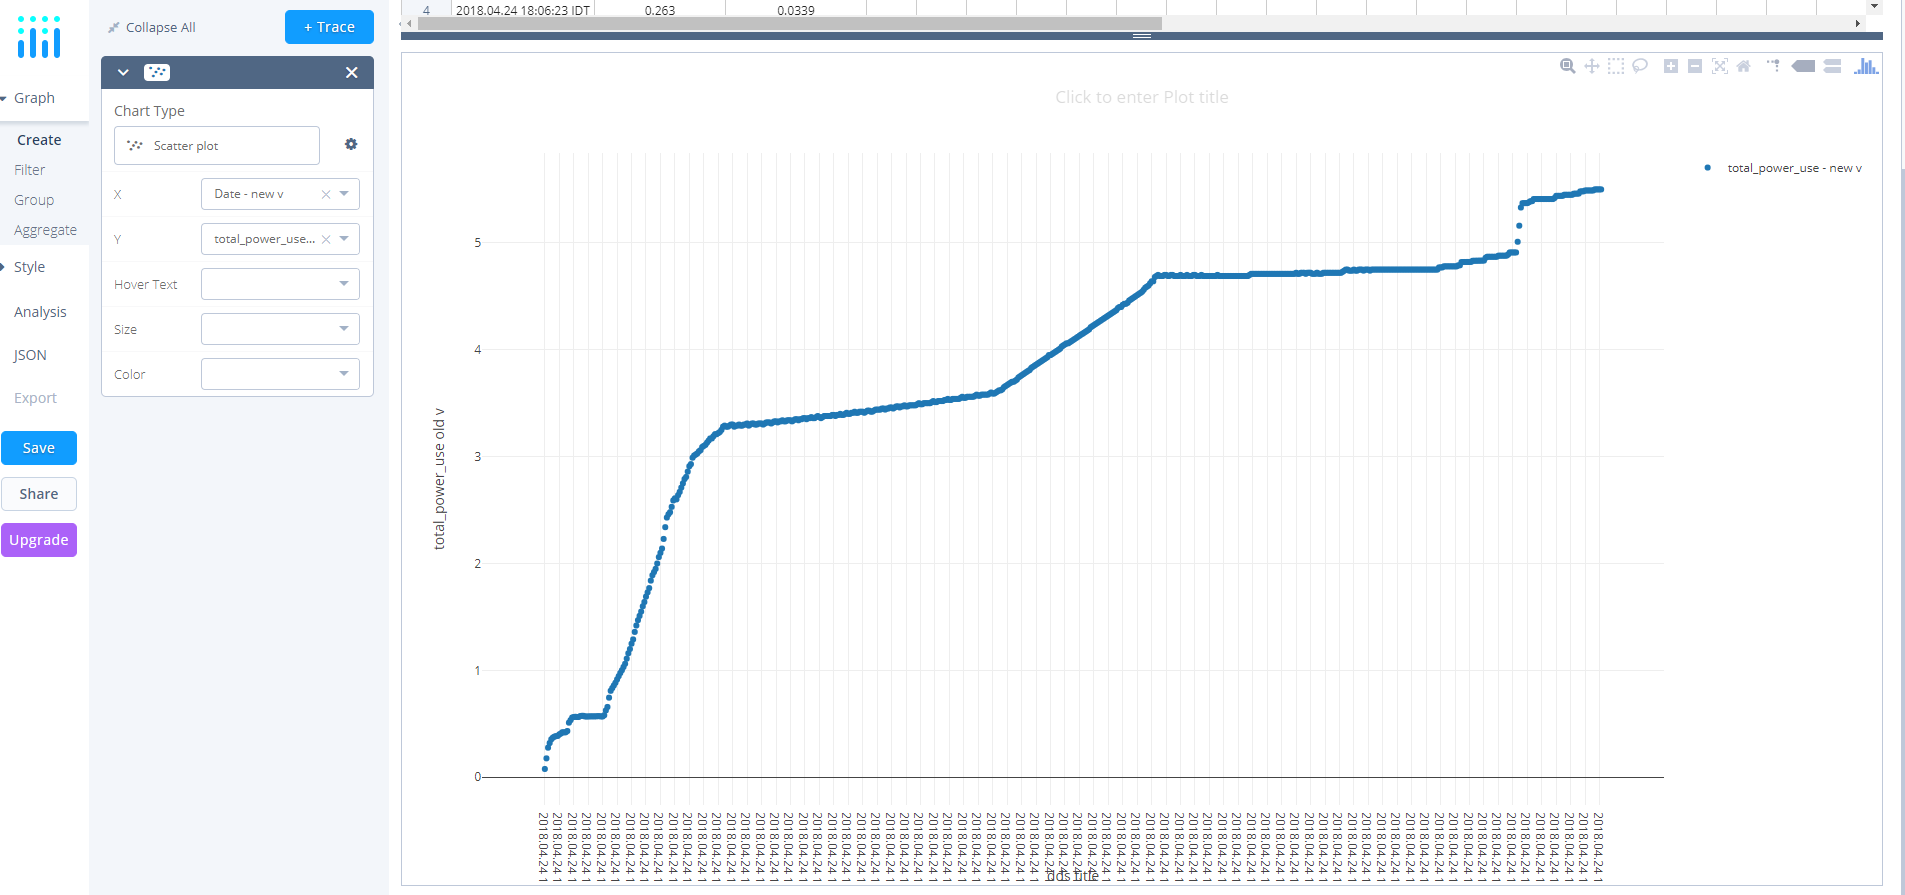
After generating the results.csv, you can import it into this site. (you can import multiple .csv files in order to compare between them)
Select the time and date as X axis and the total battery value as Y axis.
A graph such as this will be created and you can visually see you app's battery consumption over time:
