![]()
Application Maturity Analysis
The Application Maturity Analysis dashboard provides a snapshot view of your application maturity in terms of how mature is the application deployment using Deploy. This dashboard provides an overview of the current month’s application growth from the deployment point of view. You can compare the annual growth percentage of applications and the associated deployments and environments. The dashboard data is fetched based on parameters such as application added to a deployment tool, applications deployment activity, and application maturity when the application is deployed in multiple environments.
The Application Maturity Analysis dashboard helps a Deploy Manager answer the following business questions:
- Can I examine the application maturity in terms of deployment over the last 13 months or 13 weeks of data?
- Can I Identify the issues or delays related to the application deployment process and provide support to resolve them?
- What is the success rate of application deployment processes?
- What is the actual and average growth in application deployment?
This dashboard is built using the deployment and deployment_application datasets.
The Application Maturity Analysis dashboard consists of the following sections:
- KPIs: By default, the KPIs listed on this dashboard show the value for the current month. The following KPIs drive the sections in the monthly and weekly panels of the dashboard:
- Applications Used: The total number of applications deployed in the current month.
- Applications More Than 1 Deployment: The number of applications associated with multiple deployments in any environment.
- Applications More Than 2 Environments: The number of applications deployed in more than two different environment types.
- Applications Where Deployment Failure Rate More Than Ideal: The count of applications where the deployment failure rate is greater than the average failure rate.
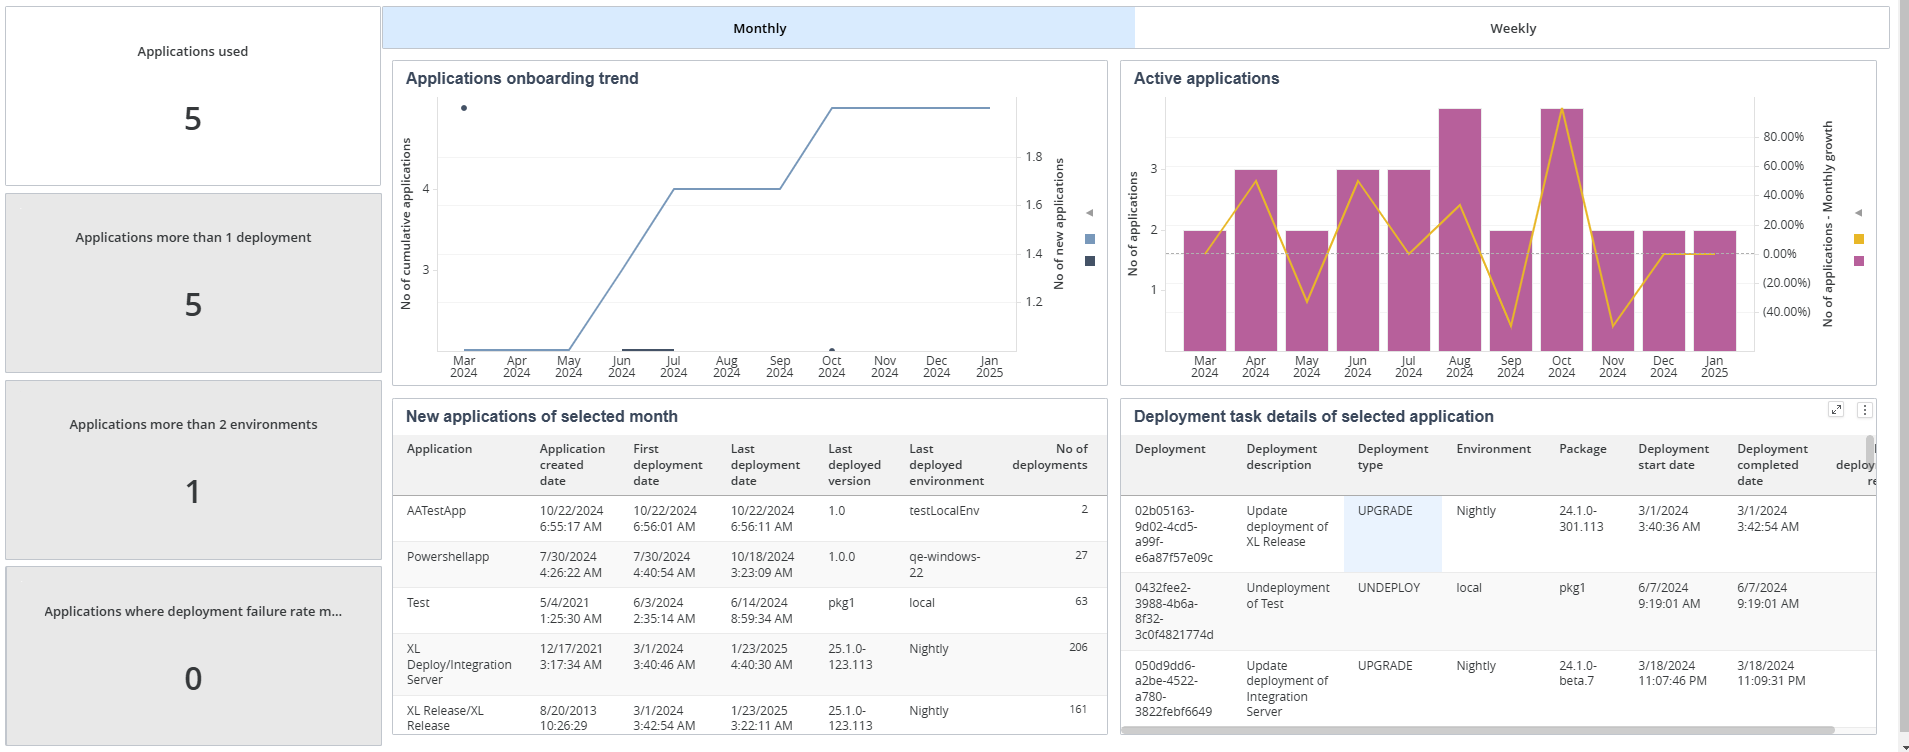
- Monthly: The information on this Monthly tab covers 13 months of data. Using this tab, you can drill down into the Monthly values and the associated deployment details. Following is an example of the monthly tab.
- Weekly: The Weekly tab provides the data for the last 13 weeks. Using this tab, you can drill down into the Weekly values and the associated deployment details. Following is an example of the weekly tab.
Applications Used
Applications Used KPI displays the total number of applications deployed in the current month. The dashboard displays panels related to the Applications Used KPI by default.
Applications Onboarding Trend
This panel in the Monthly or Weekly tab displays the trend of new applications deployed compared to cumulative applications. The X-axis represents the calendar month or week, and the Y-axis represents the number of new and cumulative applications accordingly. You can drill down to a specific month’s or week’s data by selecting the required month or week from the graph.
Active Applications
This panel in the Monthly or Weekly tab displays the trend of the number of deployed applications and their monthly or weekly growth. The graph’s Y-axis displays the number of deployed applications and their growth percentages, while the X-axis shows the calendar months or weeks accordingly.
New Applications of Selected Month or Week
This panel displays details of the newly added applications for a specific month or week, along with the Created Date, First Deployed Date, Last Deployed Date, Last Deployed Version, Last Deployed Environment, Deployment Count, and Number of Failed Deployments. You can select an individual application to view the associated deployment details. The Applications on-boarding Trend panel drives the data in this panel.
Deployment Task Details of Selected Application
This panel in the Monthly and Weekly tab provides the deployment task-related details such as the Deployment Number, Description, Type, Environment, Environment Stage, Package, Started On, Completed On, and Number of Retries associated with the selected application. The New Applications of Selected Month or Week panel drives the data in this panel.
Applications More Than 1 Deployment
Applications More Than 1 Deployment KPI displays the number of applications associated with multiple deployments in any environment. Following are the steps to view detailed information in the Monthly and Weekly Panels:
- Click Applications More Than 1 Deployment from KPIs.
- Click the Monthly or Weekly panel to load the corresponding data in the panel.
Applications Onboarding Trend
This panel in the Monthly or Weekly tab displays the trend of new applications with more than one deployment compared to the cumulative count of applications with more than one deployment. The X-axis represents the calendar month or week, and the Y-axis represents the count of new and cumulative applications with more than one deployment. You can drill down to a specific month’s or week’s data by selecting the required month or week from the graph.
Active Applications Deployed More Than Once
This panel in the Monthly or Weekly tab provides the trend of the applications associated with more than one deployment irrespective of the environment and their monthly or weekly growth. The graph’s Y-axis displays the number of applications deployed more than once and their growth percentages, while the X-axis shows the calendar months or weeks accordingly.
New Applications > 1 Deployments to any Environment of Selected Month or Week
The panel displays details of the newly added applications with more than one deployment irrespective of the environment for a specific month or week. Additionally, this panel provides details of the Application Name, Created Date, First and Last Deployment Date, Last Deployed Version, Deployment Count, Number of Failed Deployments, and Average Number of Deployment Retries associated with the newly added applications in the Monthly or Weekly panel respectively. You can select an individual application to view the associated deployment details. The Applications on-boarding Trend panel drives the data in this panel.
Deployment Task Details of Selected Application
Details of Selected Application panel in the Monthly and Weekly panel provides deployment task-related details such as the Deployment Number, Description, Type, Package, Environment, Deployment Status, Average Deployment Time (Hours), and Average Number of Deployment Retries associated with the selected application. The New Applications > 1 Deployment to any Environment of Selected Month or Week panel drives the data in this panel.
Applications More Than 2 Environments
Applications More Than 2 Environments KPI displays the number of applications deployed in more than two different environment types. Following are the steps to view detailed information in the Monthly and Weekly Panels:
- Click Applications More Than 2 Environments from KPIs.
- Click the Monthly or Weekly panel to load the corresponding data in the panel.
Applications Onboarding Trend
This panel in the Monthly or Weekly panel shows the trend of new and cumulative counts of applications deployed in more than two environments. The X-axis represents the calendar month or week, and the Y-axis represents the count of new and cumulative applications deployed in more than two environments accordingly. You can drill down to a specific month’s or week’s data by selecting the required month or week from the graph.
Active Applications with Deployments in >2 Environments
This panel in the Monthly or Weekly panel displays the trend of the applications deployed in more than two environments and their monthly or weekly growth. The graph’s Y-axis shows the number of applications deployed in more than two environments and their growth percentages, while the X-axis shows the calendar months or weeks accordingly.
New Applications with Deployments in > 2 Environment of Selected Month or Week
This panel displays details of the newly added application deployed in more than two environments for a specific month or week. Additionally, this panel provides details of the Application Name, Created Date, Last Deployed Version, Last Deployed Environment, Deployment Count, Number of Failed Deployments, and Average Number of Deployment Retries. You can select an individual application to view the associated deployment details. The Applications on-boarding Trend panel drives the data in this panel.
Deployment Task Details of Selected Application
This panel in the Monthly and Weekly panels provides deployment task-related details such as the Deployment Number, Description, Type, Package, Environment, Status, Average Deployment Time (Hours), and Number of Retries associated with the selected application. The New Applications with Deployments > 2 Environment of Selected Month or Week panel drives the data in this panel.
Applications where Deployment Failure Rate More Than Ideal
This KPI displays the count of applications where the deployment failure rate is more than the average failure rate. The ideal failure value is set to 0.05 by default, and you can configure the property based on your requirements. Following are the steps to view detailed information in the Monthly and Weekly Panels:
- Click Applications where Deployment Failure Rate More Than Ideal.
- Click the Monthly or Weekly panel to load the corresponding data in the panel.
Applications Onboarding Trend
This panel in the Monthly or Weekly panel shows the trend of application counts where the deployment failure rate is more than ideal. The X-axis represents the calendar month or week, and the Y-axis represents the count of applications where the deployment failure rate is more than ideal accordingly. You can drill down to a specific month’s or week’s data by selecting the required month or week from the graph.
Active Applications where Deployment Failure > Ideal
This panel in the Monthly or Weekly panel provides the monthly or weekly trend of the applications with deployment failure rate greater than expected and their monthly or weekly growth rate. The graph’s Y-axis displays the application count and their growth percentages, while the X-axis shows the calendar months or weeks accordingly.
Applications where Deployment Failure > Ideal of Selected Month or Week
This panel displays details of the newly added applications with deployment failure greater than the ideal value for a specific month or week. Additionally, this panel provides details of the Application Name, Created Date, First and Last Deployment Date, Last Deployed Version, Last Deployed Environment, Deployment Count, % Failed Deployments, and Number of Failed Deployments. You can select an individual application to view the associated deployment details. The Applications on-boarding Trend panel drives the data in this panel.
Deployment Task Details of Selected Application
The Deployment Task Details of Selected Application panel in the Monthly and Weekly panels provides deployment task-related details such as the Deployment Number, Description, Type, Package, Environment, Status, Average Deployment Time (Hours), and Number of Retries associated with the selected application. The Applications where Deployment Failure > Ideal of Selected Month or Week panel drives the data in this panel. Objects used in this dashboard The following tables list all the attributes and metrics used to build the reports in this dashboard.
Objects used in this dashboard
This section lists all the attributes and metrics used to build the reports in this dashboard.
Attributes
| Dataset Name | Attribute Name | Description |
|---|---|---|
| deployment, deployment_application | Application | Name of the Application linked to Release Task Attribute Type Deployment |
| deployment_application | Application Created Date | The date when an application instance is created in a deployment environment |
| deployment | Calendar Month | Gregorian calendar month |
| deployment | Deployment | Unique identifier for the deployment |
| deployment | Deployment Completed Date | Date on which the deployment was completed |
| deployment | Deployment Description | Description of the deployment |
| deployment_application | Deployment Month | Specific month in which an application is made operational |
| deployment | Deployment Start Date | The date on which the deployment task is supposed to start |
| deployment | Deployment Status | Current status of the deployment |
| deployment | Deployment Type | Type of deployment that is being carried out |
| deployment | Environment | Name of the environment which is linked to Release Task attribute type Deployment |
| deployment_application | First Deployed Date | First date of the application deployed |
| deployment_application | Last Deployed Environment | Environment of release task application last deployed |
| deployment_application | Last Deployed Version | Latest version of release task application deployed |
| deployment_application | Last Deployed Date | Last date of the application deployed |
| deployment | Package | Name of the deployment package |
Metrics
| Dataset Name | Metric Name | Description |
|---|---|---|
| deployment | % Failed Deployments | Percentage of deployments that failed or yielded number results |
| deployment | Avg Deployment Retries | Average number of times a deployment failed and retriggered again |
| deployment | Avg Deployment Time Hours | Average time of deployments in hours |
| deployment | No of Applications | The number of applications deployed |
| deployment | No of Applications - monthly growth (%) | Monthly growth count of applications from deployments compared to previous month |
| deployment | No of Applications > 1 Deployment - Month Growth | Number of applications where it was deployed to more than 1 environment at month level compared to previous month |
| deployment | No of Applications > 1 Deployment in month | Number of applications that were deployed to more than one environment per month |
| deployment | No of Applications > 2 Deployed Environments in Month | Number of applications that were deployed to more than two environments per month |
| deployment | No of Applications > 2 Deployed Environments in Month - Monthly Growth | Number of applications where it was deployed to more than 2 environment at month level compared to last month |
| deployment | No of Applications Failure Rate > Ideal - Monthly Growth | Monthly growth of applications where deployment failure rate is more than a defined acceptable target failure rate compared to last month |
| deployment | No of Applications Failure Rate > Ideal in Month | Count of applications where deployment failure rate is more than a defined acceptable target failure rate |
| deployment_application | No of Cumulative Applications | Count of cumulative applications |
| deployment_application | No of Cumulative Applications > 1 deployment in month | The total number of applications deployed in more than one environment within a given month |
| deployment_application | No of Cumulative Application > 2 Deployed Environments in Month | The total number of applications deployed in more than two different environments within a given month |
| deployment | No of Deployment Retries | Average number of times a deployment failed and retriggered again |
| deployment | No of Deployments | Number of deployments attempted for a particular release |
| deployment | No of Failed Deployments | Count of deployments whose status are Failed |
| deployment_application | No of New Applications | Count of new applications |
| deployment_application | No of New Applications > 1 Deployment in month | Number of new applications that were deployed to more than one environment per month |
| deployment_application | No of New Applications > 2 Deployed Environments in Month | Number of new applications that were deployed to more than two environments per month |