Application Deployment Analysis
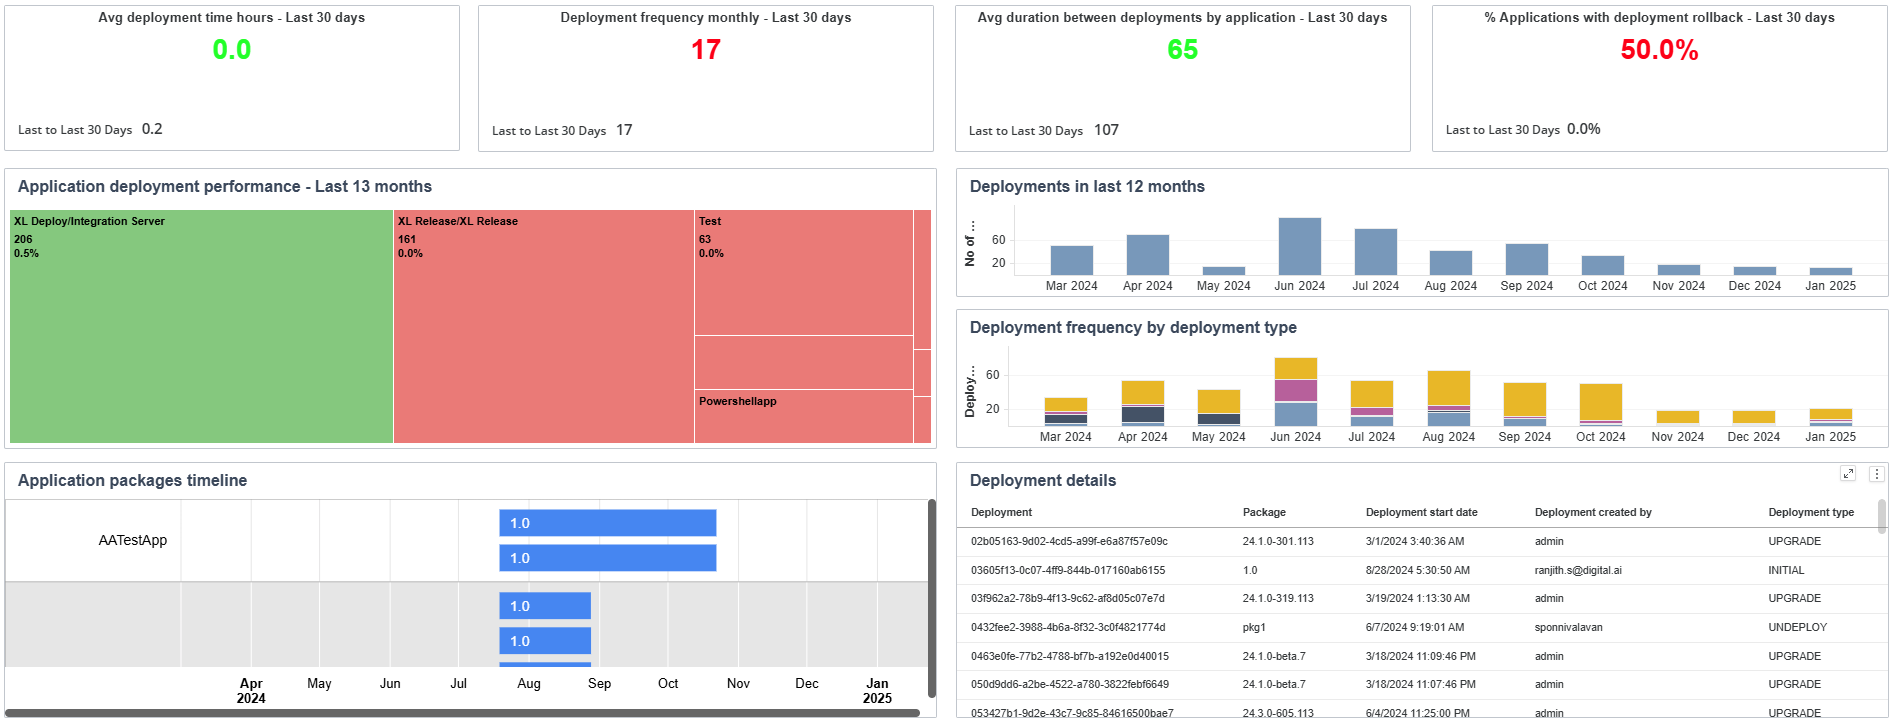
The Application Deployment Analysis dashboard provides an overall view of the deployments from an applications perspective using the Application-based deployment KPIs. Using this dashboard, you can also drill down and view detailed information about deployments process to ensure efficiency, reliability, and performance.
As a Deployment Manager, using the Application Deployment View Analysis dashboard you can:
- Evaluate the impact of upcoming application deployments.
- Plan for the backup of the applications and assess the effects of any downtime associated with that application.
- View and analyze the performance of an application's deployment and find the areas that require any action.
This dashboard is built using the 'deployment' and the 'deployment_frequency' datasets.

You can filter and view the required data using the following filters:
- Environment: Displays data about a specific environment in which the deployment was carried out.
The Application Deployment Analysis dashboard consists of the following sections:
KPIs
- Avg Deployment Time (Hours) - Last 30 days: Provides the average time of deployment in hours for last 30 days and the previous 30 days.
- Deployment Frequency Monthly - Last 30 days: Provides the total number of deployments addressed in the last 30 days and the previous 30 days.
- Avg Duration Between Deployments by Application - Last 30 days: Provides the average of deployments completed successfully in the last 30 days and the previous 30 days.
- % Applications with Deployment Rollback - Last 30 days: Provides the percentage of applications which have any rollback in the last 30 days and the previous 30 days.
Application Deployment Performance - Last 13 months
This section displays a tree map to help you to understand the performance of deployments related to individual applications and provides information about the Application Name, Deployment Count, and percentage of Failed Deployments. The details provided will help you recognize and investigate the applications that have high failed deployments rate and can take measures to mitigate them. Each tile corresponds to an application and the size of the tile associated to its deployment count. You can hover over a tile to view the details of Application, associated Failed Deployment percentage, and Deployment Count.
Selection of an application from this panel drives the data of the Deployments in Last 12 Months, Deployment Frequency by Deployment Type, Application Packages Timeline and Deployment Details panel.
Deployments in Last 12 Months
This section displays a vertical bar graph with the last 12 months’ deployment count and helps you to understand the trend of deployments. You can hover over a vertical bar to view the count of deployments.
Deployment Frequency by Deployment Type
This section displays a vertical bar graph that provides details of monthly deployment frequency for last 13 months and color coded to indicate the deployment type such as initial, undeploy, rollback, and upgrade. This section helps you to understand the trend of deployments by deployment types. You can hover over a vertical bar to view the count of deployments based on its type.
Application Packages Timeline
This section helps you analyze the timeline for each package in terms of deployment and provides details such as, the Application Name, Package Name, and deployment duration as Start and End deployment month and year.
Deployment Details
This section provides a view of specific details related to a deployment such as Deployment ID, Package Name, Deployment Start Date, Created By, and the type of Deployment.
Components used in this dashboard
This section lists all the attributes and metrics used to build the reports in this dashboard.
Attributes
| Dataset Name | Attribure Name | Description |
|---|---|---|
| deployment | Application Name | Name of the Application |
| deployment, deployment_frequency | Calendar Month | Deployment Gregorian calendar month displayed in the format 'Mon YYYY' |
| deployment, deployment_frequency | Deployment Type | Type of deployment that is being carried out |
| deployment | Package | Deployment Package name |
| deployment | Package First Deployment Date | Date on which the package was initially deployed |
| deployment | Deployment ID | Unique identifier for the deployment |
| deployment | Deployment Start Date | The date on which the deployment task is supposed to start |
| deployment | Deployment Created By | Person who created the deployment |
Metrics
| Dataset Name | Metric Name | Description |
|---|---|---|
| deployment | Avg Deployment Time (Hours) - Last 30 Days | Average Time of Deployments in Hours |
| deployment_frequency | Deployment Frequency Monthly - Last 30 Days | Monthly Avg No of Deployments - Rolling 30 days average |
| deployment | Avg Duration between deployments by Application - Last 30 days | Time Between Deployments by Application in days |
| deployment | % Applications with Deployment Rollback - Last 30 days | Ratio of No of applications which have any rollback to total number applications |
| deployment | No of Deployments | Number of Deployments |
| deployment | % Failed Deployments | Percentage of number of deployments which are unsuccessful |